This resource can be used in providing real-life activity for students by conducting …
This resource can be used in providing real-life activity for students by conducting survey. Results of their survey will be organized and presented through text, graphs and tables with research ethics observed.
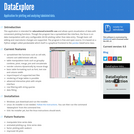
This is a desktop application for visualization of data with convenient plotting …
This is a desktop application for visualization of data with convenient plotting functions. It is intended for educational/scientific use and teaching data analysis skills such as aggregation, merging data and getting statistics. Though the program has a spreadsheet like interface, the focus is on data manipulation with very configurable 2D/3D plotting rather than data entry. Though basic cell editing and row/column changes are supported. The program is open source., licensed under the GPL. This program is suitable for use by secondary school and third level students wishing to learn about data manipulation and advanced plotting.
Learn about graphing polynomials. The shape of the curve changes as the …
Learn about graphing polynomials. The shape of the curve changes as the constants are adjusted. View the curves for the individual terms (e.g. y=bx ) to see how they add to generate the polynomial curve.
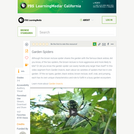
Build a gene network! The lac operon is a set of genes …
Build a gene network! The lac operon is a set of genes which are responsible for the metabolism of lactose in some bacterial cells. Explore the effects of mutations within the lac operon by adding or removing genes from the DNA.
Rate Type of Unit: Concept Prior Knowledge Students should be able to: …
Rate
Type of Unit: Concept
Prior Knowledge
Students should be able to:
Solve problems involving all four operations with rational numbers. Understand quantity as a number used with a unit of measurement. Solve problems involving quantities such as distances, intervals of time, liquid volumes, masses of objects, and money, and with the units of measurement for these quantities. Understand that a ratio is a comparison of two quantities. Write ratios for problem situations. Make and interpret tables, graphs, and diagrams. Write and solve equations to represent problem situations.
Lesson Flow
In this unit, students will explore the concept of rate in a variety of contexts: beats per minute, unit prices, fuel efficiency of a car, population density, speed, and conversion factors. Students will write and refine their own definition for rate and then use it to recognize rates in different situations. Students will learn that every rate is paired with an inverse rate that is a measure of the same relationship. Students will figure out the logic of how units are used with rates. Then students will represent quantitative relationships involving rates, using tables, graphs, double number lines, and formulas, and they will see how to create one such representation when given another.
In this lesson, students represent quantitative relationships involving rates using tables, graphs, …
In this lesson, students represent quantitative relationships involving rates using tables, graphs, double number lines, and formulas. Students will understand how to create one such representation when given another representation.Key ConceptsQuantitative relationships involving rates can be represented using tables, graphs, double number lines, and formulas. One such representation can be used to create another representation. Two rates can describe each situation: the rate and its inverse. For the water pump situation, there are two related formulas: a formula for finding the quantity of water pumped for any amount of time, and a formula for finding the amount of time for any quantity of water.Goals and Learning ObjectivesUnderstand that tables, graphs, double number lines, and formulas can be used to represent the same situation.Compare the different representations within a situation and the same representation across similar situations.Understand each representation and how to find the rate in each one.
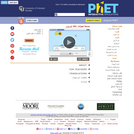
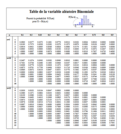
Tables de probabilités et de statistiques : Table de calcul de probabilité …
Tables de probabilités et de statistiques : Table de calcul de probabilité pour la loi binomiale Table de calcul de probabilité pour la loi normale Table des quantiles de la v.a. Chi-Carré Table des quantiles de la v.a. Fisher Table des quantiles de la v.a. Normale réduite Table des quantiles de la v.a. Student
A work in progress, this FlexBook is an introduction to theoretical probability …
A work in progress, this FlexBook is an introduction to theoretical probability and data organization. Students learn about events, conditions, random variables, and graphs and tables that allow them to manage data.
Dawson (1995) presented a data set giving a population at risk and …
Dawson (1995) presented a data set giving a population at risk and fatalities for an “unusual episode” (the sinking of the ocean liner Titanic) and discussed the use of the data set in a first statistics course as an elementary exercise in statistical thinking, the goal being to deduce the origin of the data. Simonoff (1997) discussed the use of this data set in a second statistics course to illustrate logistic regression. Moore (2000) used an abbreviated form of the data set in a chapter exercise on the chi-square test. This article describes an activity that illustrates contingency table (two-way table) analysis. Students use contingency tables to analyze the “unusual episode” data (from Dawson 1995) and attempt to use their analysis to deduce the origin of the data. The activity is appropriate for use in an introductory college statistics course or in a high school AP statistics course.
The activity begins with an explanation of the Caesar Shift for message …
The activity begins with an explanation of the Caesar Shift for message encryption (Singh, 1999). The Caesar Shift is a translation of the alphabet; for example, a five-letter shift would code the letter a as f, b as g, … z as e. We describe a five-step process for decoding an encrypted message. First, groups of size 4 construct a frequency table of the letters in two lines of a coded message. Second, students construct a bar chart for a reference message of the frequency of letters in the English language. Third, students create a bar chart of the coded message. Fourth, students visually compare the bar chart of the reference message (step 2) to the bar chart of the coded message (step 3). Based on this comparison, students hypothesize a shift. Fifth, students apply the shift to the coded message.
This activity is an advanced version of the “Keep your eyes on …
This activity is an advanced version of the “Keep your eyes on the ball” activity by Bereska, et al. (1999). Students should gain experience with differentiating between independent and dependent variables, using linear regression to describe the relationship between these variables, and drawing inference about the parameters of the population regression line. Each group of students collects data on the rebound heights of a ball dropped multiple times from each of several different heights. By plotting the data, students quickly recognize the linear relationship. After obtaining the least squares estimate of the population regression line, students can set confidence intervals or test hypotheses on the parameters. Predictions of rebound length can be made for new values of the drop height as well. Data from different groups can be used to test for equality of the intercepts and slopes. By focusing on a particular drop height and multiple types of balls, one can also introduce the concept of analysis of variance.
An examination of a variety of mathematical concepts which focus on solving …
An examination of a variety of mathematical concepts which focus on solving problems, interpreting data, and applications. This course includes topics such as tables, graphs, basic statistics, geometric measures, and consumer mathematics. This course fulfills the BCC mathematics requirement ONLY for the Criminal Justice, Fire Science, and Human Services programs.
This article provides ideas, lessons and resources on how elementary teachers can …
This article provides ideas, lessons and resources on how elementary teachers can integrate map skills, math, and art into lessons about the geography of the Arctic and Antarctica.
This learning video presents an introduction to graph theory through two fun, …
This learning video presents an introduction to graph theory through two fun, puzzle-like problems: ''The Seven Bridges of Konigsberg'' and ''The Chinese Postman Problem''. Any high school student in a college-preparatory math class should be able to participate in this lesson. Materials needed include: pen and paper for the students; if possible, printed-out copies of the graphs and image that are used in the module; and a blackboard or equivalent. During this video lesson, students will learn graph theory by finding a route through a city/town/village without crossing the same path twice. They will also learn to determine the length of the shortest route that covers all the roads in a city/town/village. To achieve these two learning objectives, they will use nodes and arcs to create a graph and represent a real problem.
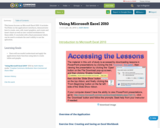
This lesson focuses on Microsoft Excel 2010. It includes YouTubes on the …
This lesson focuses on Microsoft Excel 2010. It includes YouTubes on the application's interfaces, demonstrates how to create, save, edit, insert graphics, and create and insert charts as well as user created worksheets for these skills. It concludes with a final assessment which can be used to evaluate the user's ability to use the aplication.
No restrictions on your remixing, redistributing, or making derivative works. Give credit to the author, as required.
Your remixing, redistributing, or making derivatives works comes with some restrictions, including how it is shared.
Your redistributing comes with some restrictions. Do not remix or make derivative works.
Most restrictive license type. Prohibits most uses, sharing, and any changes.
Copyrighted materials, available under Fair Use and the TEACH Act for US-based educators, or other custom arrangements. Go to the resource provider to see their individual restrictions.