This online course is designed to help anyone teach – and learn …
This online course is designed to help anyone teach – and learn – with a 21st century approach to knowledge and teaching. Lesson 1 of the course shares important evidence we now have about the working of the brain, that is meaningful for all subjects and ages – and lives. We then move to thinking together about the data filled world in which we live, to prepare students for their future in a world of data. The aim of a data science approach is not to add new standards or content to your teaching, it is about interacting with your content in a data science way – that is fun, interesting and creative. In the course you will experience lessons that you can take and use with your students, and you will see lots of classroom and lesson examples. Whether you are a kindergarten teacher, a high school history or maths teacher, an administrator or parent, or someone just curious about data science, there will be ideas for you.
This is a task from the Illustrative Mathematics website that is one …
This is a task from the Illustrative Mathematics website that is one part of a complete illustration of the standard to which it is aligned. Each task has at least one solution and some commentary that addresses important aspects of the task and its potential use.
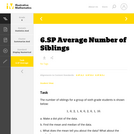
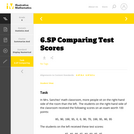
This task addresses many standards regarding the description and analysis of bivariate …
This task addresses many standards regarding the description and analysis of bivariate quantitative data, including regression and correlation. Students should recognize that the pattern shown is one of a strong, positive, linear association, and thus a correlation coefficient value near +1 is plausible. Students should also be able to interpret the slope of the least-squares line as an estimated increase in y per unit change in x (and thus for a 3 unit increase in x, students should expect an estimated increase in y that equals 3 times the model's slope value).
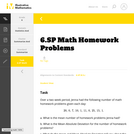
This task examines, from a mathematical and statistical point of view, how …
This task examines, from a mathematical and statistical point of view, how scientists measure the age of organic materials by measuring the ratio of Carbon 14 to Carbon 12. The focus here is on the statistical nature of such dating. This task addresses a very important issue about precision in reporting and understanding statements in a realistic scientific context.
This is a task from the Illustrative Mathematics website that is one …
This is a task from the Illustrative Mathematics website that is one part of a complete illustration of the standard to which it is aligned. Each task has at least one solution and some commentary that addresses important aspects of the task and its potential use.
This learning video deals with a question of geometrical probability. A key …
This learning video deals with a question of geometrical probability. A key idea presented is the fact that a linear equation in three dimensions produces a plane. The video focuses on random triangles that are defined by their three respective angles. These angles are chosen randomly subject to a constraint that they must sum to 180 degrees. An example of the types of in-class activities for between segments of the video is: Ask six students for numbers and make those numbers the coordinates x,y of three points. Then have the class try to figure out how to decide if the triangle with those corners is acute or obtuse.
Modeling traffic data is important for urban planning, creating transportation systems, and …
Modeling traffic data is important for urban planning, creating transportation systems, and even predicting how much foot traffic a retail store can expect in a given day. This genre of dynamic data science activities could be classified as “finding a needle in a haystack,” giving students a chance to mine big data to make insights about traffic use.
According to the Bay Area Rapid Transit District, about 400,000 people used the BART system daily in 2018. In BARTy, students investigate BART data from 2015 to learn about passenger use and explore traffic patterns. The Teacher Guide includes a game-like investigation to locate a “mystery meeting,” and suggests ways to help students figure out peak passenger use, popular stations, and the impact of events in San Francisco on BART usage.
In this task, output is given from a computer-generated simulation, generating size-100 …
In this task, output is given from a computer-generated simulation, generating size-100 samples of data from an assumed school population of 2000 students under hypotheses about the true distribution of yes/no voters.
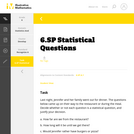
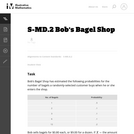
The purpose of this task is to assess a student's ability to …
The purpose of this task is to assess a student's ability to compute and interpret an expected value. Notice that interpreting expected value requires thinking in terms of a long-run average.
This book is used in Reach Higher, Oklahoma's adult degree completion program, …
This book is used in Reach Higher, Oklahoma's adult degree completion program, for a course called Data Analysis & Interpretation. It provides basic statistics that can be used for organizational data analysis by individuals with managerial professional goals, while also teaching essential skills from Microsoft Excel commonly needed for data analysis. This book uses material from Lumen Learning's Boundless Statistics (Boundless Learning) and Excel for Decision Making from University of Houston Libraries (multiple authors).
This learning video is designed to develop critical thinking in students by …
This learning video is designed to develop critical thinking in students by encouraging them to work from basic principles to solve a puzzling mathematics problem that contains uncertainty. Materials for in-class activities include: a yard stick, a meter stick or a straight branch of a tree; a saw or equivalent to cut the stick; and a blackboard or equivalent. In this video lesson, during in-class sessions between video segments, students will learn among other things: 1) how to generate random numbers; 2) how to deal with probability; and 3) how to construct and draw portions of the X-Y plane that satisfy linear inequalities.
Introductory survey of quantitative methods (QM), or the application of statistics in …
Introductory survey of quantitative methods (QM), or the application of statistics in the workplace. Examines techniques for gathering, analyzing, and interpreting data in any number of fieldsĺÎĺ from anthropology to hedge fund management.
No restrictions on your remixing, redistributing, or making derivative works. Give credit to the author, as required.
Your remixing, redistributing, or making derivatives works comes with some restrictions, including how it is shared.
Your redistributing comes with some restrictions. Do not remix or make derivative works.
Most restrictive license type. Prohibits most uses, sharing, and any changes.
Copyrighted materials, available under Fair Use and the TEACH Act for US-based educators, or other custom arrangements. Go to the resource provider to see their individual restrictions.