An introduction and examples of how to use Descriptive Statistics. It is …
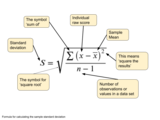
An introduction and examples of how to use Descriptive Statistics. It is about how we present and decribe the data in our sample in the best possible way. This covers tabels, graphs, measures of location and measures of spread/variability.
An introduction and examples of how to use statistical hypothesis testing, introducing …
An introduction and examples of how to use statistical hypothesis testing, introducing the five steps in the significance test: 1. Assumptions 2. Hypothesis and signifincance level 3. Test Statistic 4. P-value 5. Conclusion
6.0002 is the continuation of 6.0001 Introduction to Computer Science and Programming …
6.0002 is the continuation of 6.0001 Introduction to Computer Science and Programming in Python and is intended for students with little or no programming experience. It aims to provide students with an understanding of the role computation can play in solving problems and to help students, regardless of their major, feel justifiably confident of their ability to write small programs that allow them to accomplish useful goals. The class uses the Python 3.5 programming language.
Students learn about the statistical analysis of measurements and error propagation, reviewing …
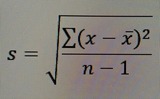
Students learn about the statistical analysis of measurements and error propagation, reviewing concepts of precision, accuracy and error types. This is done through calculations related to the concept of density. Students work in teams to each measure the dimensions and mass of five identical cubes, compile the measurements into small data sets, calculate statistics including the mean and standard deviation of these measurements, and use the mean values of the measurements to calculate density of the cubes. Then they use this calculated density to determine the mass of a new object made of the same material. This is done by measuring the appropriate dimensions of the new object, calculating its volume, and then calculating its mass using the density value. Next, the mass of the new object is measured by each student group and the standard deviation of the measurements is calculated. Finally, students determine the accuracy of the calculated mass by comparing it to the measured mass, determining whether the difference in the measurements is more or less than the standard deviation.
Lesson introduces normal distribution and how it relates to standard deviation. It …
Lesson introduces normal distribution and how it relates to standard deviation. It includes opportunities for students to notice key features of normal distribution graphs, reviews the concept of standard distribution and the empirical rule, and provides an interactive activity where they can practice adjusting normal distribution curves based on a different standard deviation or mean.
Psychology is designed to meet scope and sequence requirements for the single-semester …
Psychology is designed to meet scope and sequence requirements for the single-semester introduction to psychology course. The book offers a comprehensive treatment of core concepts, grounded in both classic studies and current and emerging research. The text also includes coverage of the DSM-5 in examinations of psychological disorders. Psychology incorporates discussions that reflect the diversity within the discipline, as well as the diversity of cultures and communities across the globe.Senior Contributing AuthorsRose M. Spielman, Formerly of Quinnipiac UniversityContributing AuthorsKathryn Dumper, Bainbridge State CollegeWilliam Jenkins, Mercer UniversityArlene Lacombe, Saint Joseph's UniversityMarilyn Lovett, Livingstone CollegeMarion Perlmutter, University of Michigan
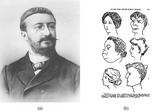
By the end of this section, you will be able to:Explain how …
By the end of this section, you will be able to:Explain how intelligence tests are developedDescribe the history of the use of IQ testsDescribe the purposes and benefits of intelligence testing
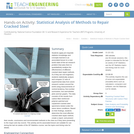
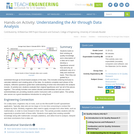
Students apply pre-requisite statistics knowledge and concepts learned in an associated lesson …
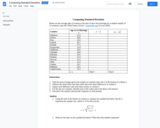
Students apply pre-requisite statistics knowledge and concepts learned in an associated lesson to a real-world state-of-the-art research problem that asks them to quantitatively analyze the effectiveness of different cracked steel repair methods. As if they are civil engineers, students statistically analyze and compare 12 sets of experimental data from seven research centers around the world using measurements of central tendency, five-number summaries, box-and-whisker plots and bar graphs. The data consists of the results from carbon-fiber-reinforced polymer patched and unpatched cracked steel specimens tested under the same stress conditions. Based on their findings, students determine the most effective cracked steel repair method, create a report, and present their results, conclusions and recommended methods to the class as if they were presenting to the mayor and city council. This activity and its associated lesson are suitable for use during the last six weeks of the AP Statistics course; see the topics and timing note for details.
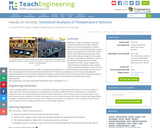
Working as if they are engineers aiming to analyze and then improve …
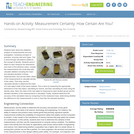
Working as if they are engineers aiming to analyze and then improve data collection devices for precision agriculture, students determine how accurate temperature sensors are by comparing them to each other. Teams record soil temperature data during a class period while making changes to the samples to mimic real-world crop conditions—such as the addition of water and heat and the removal of the heat. Groups analyze their collected data by finding the mean, median, mode, and standard deviation. Then, the class combines all the team data points in order to compare data collected from numerous devices and analyze the accuracy of their recording devices by finding the standard deviation of temperature readings at each minute. By averaging the standard deviations of each minute’s temperature reading, students determine the accuracy of their temperature sensors. Students present their findings and conclusions, including making recommendations for temperature sensor improvements.
This 15-minute video lesson looks at the margin of error--finding the 95% …
This 15-minute video lesson looks at the margin of error--finding the 95% confidence interval for the proportion of a population voting for a candidate .[Statistics playlist: Lesson 43 of 85]
This 10-minute video lesson continues the discussion of margin of error--finding the …
This 10-minute video lesson continues the discussion of margin of error--finding the 95% confidence interval for the proportion of a population voting for a candidate. [Statistics playlist: Lesson 44 of 85]
This 11-minute video lesson shows how to construct small sample size confidence …
This 11-minute video lesson shows how to construct small sample size confidence intervals using t-distributions. [Statistics playlist: Lesson 46 of 85]
Students build on their existing air quality knowledge and a description of …
Students build on their existing air quality knowledge and a description of a data set to each develop a hypothesis around how and why air pollutants vary on a daily and seasonal basis. Then they are guided by a worksheet through an Excel-based analysis of the data. This includes entering formulas to calculate statistics and creating plots of the data. As students complete each phase of the analysis, reflection questions guide their understanding of what new information the analysis reveals. At activity end, students evaluate their original hypotheses and “put all of the pieces together.” The activity includes one carbon dioxide worksheet/data set and one ozone worksheet/data set; providing students and/or instructors with a content option. The activity also serves as a good standalone introduction to using Excel.
No restrictions on your remixing, redistributing, or making derivative works. Give credit to the author, as required.
Your remixing, redistributing, or making derivatives works comes with some restrictions, including how it is shared.
Your redistributing comes with some restrictions. Do not remix or make derivative works.
Most restrictive license type. Prohibits most uses, sharing, and any changes.
Copyrighted materials, available under Fair Use and the TEACH Act for US-based educators, or other custom arrangements. Go to the resource provider to see their individual restrictions.