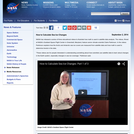
This video segment adapted from NOVA uses microwave images to reveal how …
This video segment adapted from NOVA uses microwave images to reveal how sea ice doubles the size of Antarctica each winter. Rare footage shows how sea ice crushed the famous ship Endurance in 1914.
A two-day assignment focusing in the melting or Arctic sea ice and …
A two-day assignment focusing in the melting or Arctic sea ice and the increased global temperature. The lesson involves reading the text Decline in Arctic Sea Ice, reviewing video clips, in depth discussions, and independent research and writing.
In this year's Geodynamics Seminar, we will explore the depth and breadth …
In this year's Geodynamics Seminar, we will explore the depth and breadth of scientific research related to Earth's present and past ice-sheets, glaciers and sea-ice, as well as extraterrestrial planetary ice. Invited speakers have been chosen from experts in the current frontiers in ice-related research, including planetary ice, climate records from polar and tropical ice cores, the Snowball Earth, subglacial volcanoes, ice rheology, ice sheet modeling, ice microkinetics, glacial erosion and tectonics, subglacial life and polar remote sensing. A field trip to Iceland in Summer 2006 will allow us to view some of the island's ice caps and glacial geology, the exposed mid Atlantic Ridge and evidence of ice-volcano interactions.
This article features science lesson plans to teach elementary students about the …
This article features science lesson plans to teach elementary students about the sun's energy, the relationship between light and heat, albedo, and the absorption of different surfaces. National standards and literacy integrations are provided for each lesson.
This set of three videos illustrates how math is used in satellite …
This set of three videos illustrates how math is used in satellite data analysis. The videos feature NASA senior climate scientist Claire Parkinson. Parkinson explains how the Arctic and Antarctic sea ice covers are measured from satellite data and how math is used to determine trends in the data. In the first video, she leads viewers from satellite data collection through obtaining a time series of monthly average sea ice extents for November 1978 – December 2012, for the Arctic and Antarctic. In the second video, she begins with the time series from the first video, removes the seasonal cycle by calculating yearly averages, and proceeds to calculate the slopes of the lines to get trends in the data, revealing decreasing sea ice coverage in the Arctic and increasing sea ice coverage in the Antarctic. In the third video, she uses a more advanced technique to remove the seasonal cycle and shows that the trends are close to the same, whichever method is used. She emphasizes the power of math and that the techniques shown for satellite sea ice data can also be applied to a wide range of data sets.
This article, written for students in grades 4-5, introduces the concept of …
This article, written for students in grades 4-5, introduces the concept of albedo and describes the shrinking of Arctic sea ice. Modified versions are available for students in younger grades.
This article profiles Dr. Leonid Polyak, a senior research scientist with the …
This article profiles Dr. Leonid Polyak, a senior research scientist with the Byrd Polar Research Center, The Ohio State University, who studies seafloor sediments from the Arctic Ocean to find clues about the climate conditions of the past.
In this activity, students analyze regions of sea ice using data and …
In this activity, students analyze regions of sea ice using data and ImageJ software. They measure ice mass and calculate effective albedo, and plot changes in solar energy and water/ice cover percentages. This is part 4 of a four-part activity on polar science. Data access information is provided in the attached appendix. This activity is one of several learning activities connected with the 2007 GLOBE Earth system poster.
No restrictions on your remixing, redistributing, or making derivative works. Give credit to the author, as required.
Your remixing, redistributing, or making derivatives works comes with some restrictions, including how it is shared.
Your redistributing comes with some restrictions. Do not remix or make derivative works.
Most restrictive license type. Prohibits most uses, sharing, and any changes.
Copyrighted materials, available under Fair Use and the TEACH Act for US-based educators, or other custom arrangements. Go to the resource provider to see their individual restrictions.