A statistics lesson on describing and making claims from data representations, specifically …
A statistics lesson on describing and making claims from data representations, specifically linearly increasing data. Applies ideas of rate-of-change to develop writing a linear equation to fit the data, using the equation to interpolate and extrapolate additional information, and integrating the mathematical interpretation appropriately into a social sciences argument.
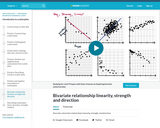
Describe a bivariate relationship's linearity, strength, and direction. In other words, plotting …
Describe a bivariate relationship's linearity, strength, and direction. In other words, plotting things that take two variables into consideration and trying to see whether there's a pattern with how they relate.
An introduction and examples of how to use Descriptive Statistics. It is …
An introduction and examples of how to use Descriptive Statistics. It is about how we present and decribe the data in our sample in the best possible way. This covers tabels, graphs, measures of location and measures of spread/variability.
Students experiment with various ways to naturally dye materials using sources found …
Students experiment with various ways to naturally dye materials using sources found in nature—roots, leaves, seeds, spices, etc.—as well as the method of extracting dyes. Then they analyze various materials using statistical methods and tackle an engineering design challenge—to find dyes that best suit the needs of a startup sustainable clothing company.
This course develops logical, empirically based arguments using statistical techniques and analytic …
This course develops logical, empirically based arguments using statistical techniques and analytic methods. Elementary statistics, probability, and other types of quantitative reasoning useful for description, estimation, comparison, and explanation are covered. Emphasis is on the use and limitations of analytical techniques in planning practice.
Students are introduced to several types of common medical sensor devices, such …
Students are introduced to several types of common medical sensor devices, such as ear and forehead thermometers, glucometers and wrist blood pressure monitors; they use the latter to measure their blood pressure and pulse rates. Students also measure their heights and weights in order to calculate their BMIs (body mass index). Then they use the collected data to create and analyze scatterplots of the different variables to determine if any relationships exist between the measured variables. Discussions about the trends observed and possible health concerns conclude the activity.
Students are tasked with designing a special type of hockey stick for …
Students are tasked with designing a special type of hockey stick for a sled hockey team—a sport designed for individuals with physical disabilities to play ice hockey. Using the engineering design process, students act as material engineers to create durable hockey sticks using a variety of materials. The stick designs will contain different interior structures that can hold up during flexure (or bending) tests. Following flexure testing, the students can use their results to iterate upon their design and create a second stick.
As teachers of statistics, we know that residual plots and other diagnostics …
As teachers of statistics, we know that residual plots and other diagnostics are important to deciding whether or not linear regression is appropriate for a set of data. Despite talking with our students about this, many students might believe that if the correlation coefficient is strong enough, these diagnostic checks are not important. The data set included in this activity was created to lure students into a situation that looks on the surface to be appropriate for the use of linear regression but is instead based (loosely) on a quadratic function.
No restrictions on your remixing, redistributing, or making derivative works. Give credit to the author, as required.
Your remixing, redistributing, or making derivatives works comes with some restrictions, including how it is shared.
Your redistributing comes with some restrictions. Do not remix or make derivative works.
Most restrictive license type. Prohibits most uses, sharing, and any changes.
Copyrighted materials, available under Fair Use and the TEACH Act for US-based educators, or other custom arrangements. Go to the resource provider to see their individual restrictions.