Using cameras mounted to drones, students will design and construct an experiment …
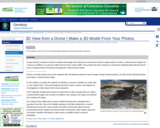
Using cameras mounted to drones, students will design and construct an experiment to take enough photos to make a 3-dimensional image of an outcrop or landform in a process called structure from motion (SfM). This activity has both a hands-on component (collecting data with the drone) and a computer-based component (creating the 3-dimensional model).___________________Drones can take photos that can be analyzed later. By planning ahead to have enough overlap between photos, you take those individual photos and make a 3-dimensional image!In this activity, you guide the students to identify an outcrop or landform to study later or over repeat visits. They go through the process to plan, conduct, and analyze an investigation to help answer their science question.The Challenge: Design and conduct an experiment to take enough photos to make a 3-dimensional image of an outcrop or landform, then analyze the image and interpret the resulting 3-d image.For instance they might wish to study a hillside that has been changed from a previous forest fire. How is the hillside starting to shift after rainstorms or snows? Monitoring an area over many months can lead to discoveries about how the erosional processes happen and also provide homeowners, park rangers, planners, and others valuable information to take action to stabilize areas to prevent landslides.
(Note: this resource was added to OER Commons as part of a batch upload of over 2,200 records. If you notice an issue with the quality of the metadata, please let us know by using the 'report' button and we will flag it for consideration.)
This is a computer-based activity in which students retrieve data from websites …
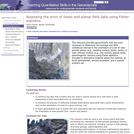
This is a computer-based activity in which students retrieve data from websites maintained by the US Geological Survey (USGS) and the National Weather Service (NWS), and then use that data to test different hypotheses regarding streamflow and precipitation. Students import data from web sites into a spreadsheet program where they can construct scatter plots and perform simple statistical tests. The activity has two components, the first focusing on relations between streamflow and drainage basin characteristics (drainage area, slope, precipitation), the second focusing on trends in annual precipitation at two locations in the USA: Burlington, VT, and Boulder, CO. As part of the second component, students conduct a statistical test to determine if the long-term trends in precipitation are significant.
(Note: this resource was added to OER Commons as part of a batch upload of over 2,200 records. If you notice an issue with the quality of the metadata, please let us know by using the 'report' button and we will flag it for consideration.)
This online set of activities help students learn properties of ocean waves, …
This online set of activities help students learn properties of ocean waves, wind-wave relationships and properties of tsunamis.
(Note: this resource was added to OER Commons as part of a batch upload of over 2,200 records. If you notice an issue with the quality of the metadata, please let us know by using the 'report' button and we will flag it for consideration.)
This activity introduces students to high precision GPS as it is used …
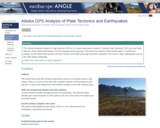
This activity introduces students to high precision GPS as it is used in geoscience research. Students build "gumdrop" GPS units and study data from three Alaska GPS stations from the Plate Boundary Observatory network. They learn how Alaska's south central region is "locked and loading" as the Pacific Plate pushes into North America and builds up energy that will be released in the future in other earthquakes such as the 1964 Alaska earthquake.
(Note: this resource was added to OER Commons as part of a batch upload of over 2,200 records. If you notice an issue with the quality of the metadata, please let us know by using the 'report' button and we will flag it for consideration.)
SETUPS (Empirical Teaching Unites in Political Science) data, published by the American …
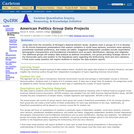
SETUPS (Empirical Teaching Unites in Political Science) data, published by the American Political Science Association, will be employed in group data analysis projects in an American Government class. Students then use results from these reports in composing an essay question on the course's final exam.
This problem illustrates how numerical theories are developed, how we might test …
This problem illustrates how numerical theories are developed, how we might test this theory with an analog model, and how numerical models are constructed and the limitations of numerical modeling.
(Note: this resource was added to OER Commons as part of a batch upload of over 2,200 records. If you notice an issue with the quality of the metadata, please let us know by using the 'report' button and we will flag it for consideration.)
Comparative planetary geology requires understanding how geological processes are affected by changes …
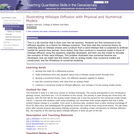
Comparative planetary geology requires understanding how geological processes are affected by changes in physical environment-each planet and moon provides an opportunity to refine our understanding of how physical geological processes operate. Volcanism is a great example of a major geological process highly susceptible to such variations. Students performing this exercise will constrain how "Amboy Crater" would look if the same eruption happened on the Moon and Mars. Part 1 of the exercise asks small groups to assess either the yield strength of the Amboy flows or the time required for the flow to travel a given distance. After discussion of the results, Part 2 asks students to characterize the dimensions of the same flow, if emplaced on Mars or the Moon (changing only gravitational acceleration), and the time required for it to form; they are asked to predict the outcome in advance. Part 3 uses "Erupt" freeware by Ken Wohletz to explore how gravity changes will affect cinder cone geometry; the model is tested first to see if it correctly predicts an Amboy-like geometry, and afterwards students are asked to brainstorm what other factors should also be modified to improve the accuracy of the simulation, and how these changes would be expected to affect the geomorphological outcome. Finally, Part 4 asks students to use simple ballistic equations, implemented via an online Applet (Stromboli), to constrain the launch angle and starting velocity for the eruption that formed Amboy Crater (modifications are supposedly underway to permit this applet to run with different values of gravitational acceleration and air resistance).
(Note: this resource was added to OER Commons as part of a batch upload of over 2,200 records. If you notice an issue with the quality of the metadata, please let us know by using the 'report' button and we will flag it for consideration.)
Students conducted data analysis about American political divisions and created two papers …
Students conducted data analysis about American political divisions and created two papers from this data analysis. Sutdents were assigned to group projects involving data analysis assigned chapters in MICROCASE AMERICAN GOVERNMENT, a textbook that includes access to a variety of datasets.
This assignment teaches geochemistry students to explain the mathematical forms of rate …
This assignment teaches geochemistry students to explain the mathematical forms of rate laws, and organize paragraphs in their writing assignments properly.
(Note: this resource was added to OER Commons as part of a batch upload of over 2,200 records. If you notice an issue with the quality of the metadata, please let us know by using the 'report' button and we will flag it for consideration.)
A student activity to determine the angle of repose and what factors …
A student activity to determine the angle of repose and what factors determine the angle of repose.
(Note: this resource was added to OER Commons as part of a batch upload of over 2,200 records. If you notice an issue with the quality of the metadata, please let us know by using the 'report' button and we will flag it for consideration.)
In this problem set students are given Rb/Sr and 87Sr/86Sr data for …
In this problem set students are given Rb/Sr and 87Sr/86Sr data for whole rock and mineral samples from three granitic intrusions in the Sierra Nevada. They use these data (in EXCEL) to calculate isochron ages and initial ages for the intrusions and then interpret their results. This problem is intended to teach some spreadsheet skills (linear regressions, graphing) as well as having them think about the use of radiogenic isotopes.
(Note: this resource was added to OER Commons as part of a batch upload of over 2,200 records. If you notice an issue with the quality of the metadata, please let us know by using the 'report' button and we will flag it for consideration.)
This lab exercise provides students with activities utilizing vector operations within the …
This lab exercise provides students with activities utilizing vector operations within the context of the atmospheric and oceanic environments.
(Note: this resource was added to OER Commons as part of a batch upload of over 2,200 records. If you notice an issue with the quality of the metadata, please let us know by using the 'report' button and we will flag it for consideration.)
Student teams investigate Arctic Sea Ice by analyzing actual data and making …
Student teams investigate Arctic Sea Ice by analyzing actual data and making predictions. A worthwhile extension is to predict the first year that the Arctic Ocean will be ice free.
(Note: this resource was added to OER Commons as part of a batch upload of over 2,200 records. If you notice an issue with the quality of the metadata, please let us know by using the 'report' button and we will flag it for consideration.)
This assignment introduces students to commonly used datasets in ethnic conflict studies. …
This assignment introduces students to commonly used datasets in ethnic conflict studies. It also encourages them to think critically about data quality and measurement challenges when using large datasets.
This module introduces students who are already familiar with GIS to doing …
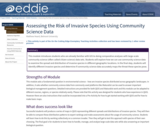
This module introduces students who are already familiar with GIS to doing comparative analyses with large-scale community science (often called citizen science) data sets. Students will explore how we can use community science data to examine the spread and distribution of invasive species in different geographic locations. In the final step, students will identify different invasive species and determine if community science data accurately maps the threat these species pose.
(Note: this resource was added to OER Commons as part of a batch upload of over 2,200 records. If you notice an issue with the quality of the metadata, please let us know by using the 'report' button and we will flag it for consideration.)
Instruction on use of Fisher statistics to determine the mean and 95% …
Instruction on use of Fisher statistics to determine the mean and 95% confidence interval of geological vectors, lines or planes, with examples, problems and an Excel spreadsheet for computation.
(Note: this resource was added to OER Commons as part of a batch upload of over 2,200 records. If you notice an issue with the quality of the metadata, please let us know by using the 'report' button and we will flag it for consideration.)
In this homework assignment students are asked to consider the balance of …
In this homework assignment students are asked to consider the balance of forces on a hill slope using the Factor of Safety.
(Note: this resource was added to OER Commons as part of a batch upload of over 2,200 records. If you notice an issue with the quality of the metadata, please let us know by using the 'report' button and we will flag it for consideration.)
This document includes two activities related to earthquake base isolation. Learners explore …
This document includes two activities related to earthquake base isolation. Learners explore earthquake hazards and damage to buildings by constructing model buildings and subjecting the buildings to ground vibration (shaking similar to earthquake vibrations) on a small shake table. Base isolation a powerful tool for earthquake engineering. It is meant to enable a building to survive a potentially devastating seismic impact through a proper initial design or subsequent modifications. The buildings are constructed by two- or three-person learner teams.
(Note: this resource was added to OER Commons as part of a batch upload of over 2,200 records. If you notice an issue with the quality of the metadata, please let us know by using the 'report' button and we will flag it for consideration.)
This is an Excel spreadsheet and graph that illustrates standard "batch" and …
This is an Excel spreadsheet and graph that illustrates standard "batch" and Rayleigh decarbonation models and how they can be used to detect fluid infiltration during metamorphism of carbonates. It makes a good lecture demonstration, but with a few modifications can be turned into a laboratory exercise. Key variables are "hotlinked" directly into the batch and Rayleigh models so students can adjust them to get a feel for the influence of different model parameters. The included carbon isotope data are from marbles in the Jervois region, central Australia (Cartwright et al., 1997). Oxygen isotope data are also included in the spreadsheet.
(Note: this resource was added to OER Commons as part of a batch upload of over 2,200 records. If you notice an issue with the quality of the metadata, please let us know by using the 'report' button and we will flag it for consideration.)
No restrictions on your remixing, redistributing, or making derivative works. Give credit to the author, as required.
Your remixing, redistributing, or making derivatives works comes with some restrictions, including how it is shared.
Your redistributing comes with some restrictions. Do not remix or make derivative works.
Most restrictive license type. Prohibits most uses, sharing, and any changes.
Copyrighted materials, available under Fair Use and the TEACH Act for US-based educators, or other custom arrangements. Go to the resource provider to see their individual restrictions.