This resource is a video abstract of a research paper created by …
This resource is a video abstract of a research paper created by Research Square on behalf of its authors. It provides a synopsis that's easy to understand, and can be used to introduce the topics it covers to students, researchers, and the general public. The video's transcript is also provided in full, with a portion provided below for preview:
"In ecology research, population density is an important metric for community analysis studies. Yet even though microbiomes are small ecosystems, microbiome studies rarely report the bacterial density. To evaluate the significance of bacterial density in gut microbiome research, a recent retrospective study examined rectal swabs from hospitalized patients. The authors found that bacterial density had important methodologic significance, as it predicted vulnerability to sequencing contamination. Specifically, low-bacterial-density specimens had higher levels of sequencing contamination. Clinical factors like age, exposure to antibiotics, and comorbidities also varied with bacterial density. Older patients and those with multiple co-morbidities had high bacterial density, while antibiotic exposure correlated with low density. Lastly, bacterial density showed potential as a prognostic indicator, as the density at time of admission correlated with subsequent infection..."
The rest of the transcript, along with a link to the research itself, is available on the resource itself.
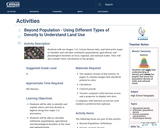
Students will use images, U.S. Census Bureau data, and interactive maps to …
Students will use images, U.S. Census Bureau data, and interactive maps to visualize and calculate arithmetic (population), agricultural, and physiological densities at local, regional, and national scales. They will also transfer their calculations to bar graphs.
Biology is designed for multi-semester biology courses for science majors. It is …
Biology is designed for multi-semester biology courses for science majors. It is grounded on an evolutionary basis and includes exciting features that highlight careers in the biological sciences and everyday applications of the concepts at hand. To meet the needs of today’s instructors and students, some content has been strategically condensed while maintaining the overall scope and coverage of traditional texts for this course. Instructors can customize the book, adapting it to the approach that works best in their classroom. Biology also includes an innovative art program that incorporates critical thinking and clicker questions to help students understand—and apply—key concepts.
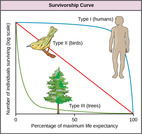
By the end of this section, you will be able to:Describe how …
By the end of this section, you will be able to:Describe how ecologists measure population size and densityDescribe three different patterns of population distributionUse life tables to calculate mortality ratesDescribe the three types of survivorship curves and relate them to specific populations
This resource is a video abstract of a research paper created by …
This resource is a video abstract of a research paper created by Research Square on behalf of its authors. It provides a synopsis that's easy to understand, and can be used to introduce the topics it covers to students, researchers, and the general public. The video's transcript is also provided in full, with a portion provided below for preview:
"The Earth is undeniably getting hotter. For the third time in a row, the past year has gone down as the hottest on record. While researchers don’t expect every year to be record-shattering, the trend is disconcerting—perhaps nowhere more so than in South Asia. A new study shows that here, unique climate effects converge with poor living conditions and high population density to create the most at-risk hot spot on our planet. Climate data shows that some of the world’s hottest zones lie across Asia. In these areas, the wet-bulb temperature, a measure of temperature that accounts for humidity, reaches life-threatening highs, commonly above 28°C. For perspective, consider that spending just a few hours at a wet-bulb temperature of 35°C is enough to cause death. And according to an international team of researchers, this heating trend might only get worse..."
The rest of the transcript, along with a link to the research itself, is available on the resource itself.
This is a powerpoint presentation on "Growth Rate As A Factor Determining …
This is a powerpoint presentation on "Growth Rate As A Factor Determining The population Density" prepared by Shalini Tudu a PhD Scholar [Zoology]. The contents of the ppt have been referred from various websites and the images have been taken from google. Also at the end of the ppt the references are mentioned in order to thank the respective websites for their contributions.
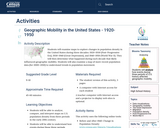
Students will examine maps to explore changes in population density in the …
Students will examine maps to explore changes in population density in the United States during three decades: 1920–1930 (Post-Progressive Era), 1930–1940 (Great Depression), and 1940–1950 (World War II). They will then determine what happened during each decade that likely influenced geographic mobility. Students will also examine a map of more recent population data (for 2000–2010) to understand trends in population movement.
Students will examine population density maps of the United States during the …
Students will examine population density maps of the United States during the 1800s. They will learn about the Louisiana Purchase in 1803 to make and evaluate predictions about the changes in population density that resulted from this event, identifying shifts in boundaries and in areas of population density, and drawing conclusions. Students will then write a paragraph summarizing the impact of the Louisiana Purchase on the United States.
Rate Type of Unit: Concept Prior Knowledge Students should be able to: …
Rate
Type of Unit: Concept
Prior Knowledge
Students should be able to:
Solve problems involving all four operations with rational numbers. Understand quantity as a number used with a unit of measurement. Solve problems involving quantities such as distances, intervals of time, liquid volumes, masses of objects, and money, and with the units of measurement for these quantities. Understand that a ratio is a comparison of two quantities. Write ratios for problem situations. Make and interpret tables, graphs, and diagrams. Write and solve equations to represent problem situations.
Lesson Flow
In this unit, students will explore the concept of rate in a variety of contexts: beats per minute, unit prices, fuel efficiency of a car, population density, speed, and conversion factors. Students will write and refine their own definition for rate and then use it to recognize rates in different situations. Students will learn that every rate is paired with an inverse rate that is a measure of the same relationship. Students will figure out the logic of how units are used with rates. Then students will represent quantitative relationships involving rates, using tables, graphs, double number lines, and formulas, and they will see how to create one such representation when given another.
In this lesson, students use an interactive map to compare the crowdedness …
In this lesson, students use an interactive map to compare the crowdedness of three countries of their choice. They learn that to compare countries with different areas and populations, they need to calculate population density—a rate that compares the population of a region to its area.Key ConceptsA ratio is a comparison of two quantities by division. It can be expressed in the forms a to b, a:b, or ab, where b ≠ 0. The value of a ratio is found by dividing the two quantities. A ratio provides a relative comparison of two quantities. A rate is a ratio that compares two quantities measured in different units. Population density is a rate that compares the population of a region to its area. The value is given in number of people per unit of area.ELL: Identifying key words are crucial for students. Spend some time discussing the key vocabulary in this unit.Goals and Learning ObjectivesExplore rate in the context of population density.Compare three countries to see which is most crowded—that is, which has the greatest population density.
Students learn about population density within environments and ecosystems. They determine the …
Students learn about population density within environments and ecosystems. They determine the density of a population and think about why population density and distribution information is useful to engineers for city planning and design as well as for resource allocation.
This resource is a video abstract of a research paper created by …
This resource is a video abstract of a research paper created by Research Square on behalf of its authors. It provides a synopsis that's easy to understand, and can be used to introduce the topics it covers to students, researchers, and the general public. The video's transcript is also provided in full, with a portion provided below for preview:
"With the global health crisis of COVID-19 having widespread effects on economies and communities, understanding environmental factors that affect the transmissibility of SARS-CoV-2 is critical. Following up on a previous study demonstrating that removing shoes indoors may lower the COVID-19 mortality rate, researchers in Japan evaluated the correlation of a unique metric with COVID-19 morbidity and mortality. Tatami is a type of straw mat used for flooring in traditional Japanese-style rooms. Because people customarily remove their shoes before entering tatami rooms researchers used the density of tatami stores in a locale as a proxy for the cultural practice of shoe removal. They found that while COVID-19 morbidity and mortality increased with population density there was a negative correlation between the number of tatami stores per 100,000 people – and therefore the likelihood of shoe removal – and the number of COVID-19 cases ..."
The rest of the transcript, along with a link to the research itself, is available on the resource itself.
No restrictions on your remixing, redistributing, or making derivative works. Give credit to the author, as required.
Your remixing, redistributing, or making derivatives works comes with some restrictions, including how it is shared.
Your redistributing comes with some restrictions. Do not remix or make derivative works.
Most restrictive license type. Prohibits most uses, sharing, and any changes.
Copyrighted materials, available under Fair Use and the TEACH Act for US-based educators, or other custom arrangements. Go to the resource provider to see their individual restrictions.