Using the planetarium program Stellarium, you will display the evening sky just …
Using the planetarium program Stellarium, you will display the evening sky just after sunset for the date and location of your birthplace. You will determine the times of the sunrise, sunset, and moon rise on your birthday, note the phase of the moon, and observe planetary positions and visibility. ---------------------------------------Distant Nature: Astronomy Exercises 2016 by Stephen Tuttle under license "Creative Commons Attribution Non-Commercial Share Alike".
This activity will focus on Kepler's Law which concerns planetary motion.---------------------------------------Distant Nature: …
This activity will focus on Kepler's Law which concerns planetary motion.---------------------------------------Distant Nature: Astronomy Exercises 2016 by Stephen Tuttle under license "Creative Commons Attribution Non-Commercial Share Alike".
Edwin Hubble examined the spectra of many galaxies, looking for the red …
Edwin Hubble examined the spectra of many galaxies, looking for the red (longer wavelengths) or blue (shorter wavelengths) shifts in the spectra, indicating relative motion. To his surprise, not only did all of the galaxies appear to be moving, but all were moving away from us, no matter the direction of the galaxy. In addition, he found most galaxies exhibited a redshift, and the redshift was larger the further it was from our galaxy.Distant Nature: Astronomy Exercises 2016 by Stephen Tuttle under license "Creative Commons Attribution Non-Commercial Share Alike".
Galileo, in 1612, demonstrated that the Sun rotates on its axis with …
Galileo, in 1612, demonstrated that the Sun rotates on its axis with a rotation period of approximately one month. Our star turns in a west-to-east direction, like the orbital motions of the planets. The Sun, however, is a gas and does not have to rotate rigidly, the way a solid body like Earth does. Modern observations show that the Sun’s rotation speed varies according to latitude; that is, it’s different as you go north or south of the Sun’s equator. Between 1826 and 1850, Heinrich Schwabe, a German pharmacist and amateur astronomer kept daily records of the number of sunspots. What he was looking for was a planet inside the orbit of Mercury, which he hoped to find by observing its dark silhouette as it passed between the Sun and Earth. Unfortunately, he failed to find the hoped-for planet, but his diligence paid off with an even more important discovery: the sunspot cycle. He found that the number of sunspots varied systematically, in cycles about a decade long. In this laboratory, you will engage in tracking the Sun like Galileo and Schwabe during a six-day cycle and then do a simple calculation of the rotational period of our sun.---------------------------------------Distant Nature: Astronomy Exercises 2016 by Stephen Tuttle under license "Creative Commons Attribution Non-Commercial Share Alike".
This online set of activities help students learn properties of ocean waves, …
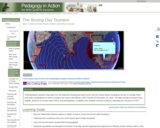
This online set of activities help students learn properties of ocean waves, wind-wave relationships and properties of tsunamis.
(Note: this resource was added to OER Commons as part of a batch upload of over 2,200 records. If you notice an issue with the quality of the metadata, please let us know by using the 'report' button and we will flag it for consideration.)
This problem illustrates how numerical theories are developed, how we might test …
This problem illustrates how numerical theories are developed, how we might test this theory with an analog model, and how numerical models are constructed and the limitations of numerical modeling.
(Note: this resource was added to OER Commons as part of a batch upload of over 2,200 records. If you notice an issue with the quality of the metadata, please let us know by using the 'report' button and we will flag it for consideration.)
In preparation for this lab activity, students have read the textbook material …
In preparation for this lab activity, students have read the textbook material on Waves (Garrison, 6th ed., Oceanography), and attended a lecture on the same topic. In class, students will access Coastal Data Information Program (CDIP) data published by the Ocean Engineering Research Group, Center for Coastal Studies, Scripps Institute of Oceanography. Students will compile specific real-time wave and sea surface temperature data sets as specified in the lab assignment. This requires students to generate and interpret multiple graphs from the available data, set-up their own system of data acquisition, and interpret the wave height and sea surface data in the context of the local physical oceanographic parameters.
(Note: this resource was added to OER Commons as part of a batch upload of over 2,200 records. If you notice an issue with the quality of the metadata, please let us know by using the 'report' button and we will flag it for consideration.)
During this exercise, students compare a series of satellite images taken 3-4 …
During this exercise, students compare a series of satellite images taken 3-4 years apart to investigate the effects of human land use and annotate the images using ImageJ software.
(Note: this resource was added to OER Commons as part of a batch upload of over 2,200 records. If you notice an issue with the quality of the metadata, please let us know by using the 'report' button and we will flag it for consideration.)
This lab exercise provides students with activities utilizing vector operations within the …
This lab exercise provides students with activities utilizing vector operations within the context of the atmospheric and oceanic environments.
(Note: this resource was added to OER Commons as part of a batch upload of over 2,200 records. If you notice an issue with the quality of the metadata, please let us know by using the 'report' button and we will flag it for consideration.)
In this homework assignment students are asked to consider the balance of …
In this homework assignment students are asked to consider the balance of forces on a hill slope using the Factor of Safety.
(Note: this resource was added to OER Commons as part of a batch upload of over 2,200 records. If you notice an issue with the quality of the metadata, please let us know by using the 'report' button and we will flag it for consideration.)
empty (Note: this resource was added to OER Commons as part of …
empty
(Note: this resource was added to OER Commons as part of a batch upload of over 2,200 records. If you notice an issue with the quality of the metadata, please let us know by using the 'report' button and we will flag it for consideration.)
Students are given an outline map of the campus with no scale …
Students are given an outline map of the campus with no scale indicated. They are to work in small groups to determine the scale. Although rules and tape measures are provided, students are given no instruction on how to best determine the scale and are tasked with devising their own methodology. Students write their scales on the blackboard and we finish the class with a discussion of their various methodologies, sources of error, and why there is some variation among their results.
(Note: this resource was added to OER Commons as part of a batch upload of over 2,200 records. If you notice an issue with the quality of the metadata, please let us know by using the 'report' button and we will flag it for consideration.)
Reading and constructing geologic maps is one skill that every geologists has …
Reading and constructing geologic maps is one skill that every geologists has to master. Initially, this means that we have to understand the symbols that are used on geologic maps. Once we know the general meaning of these symbols, we will have to learn how to measure and plot them. The measuring is generally done using a magnetic compass. Finally, we have to plot the data on a map so that others understand the geology based on our mapping.
(Note: this resource was added to OER Commons as part of a batch upload of over 2,200 records. If you notice an issue with the quality of the metadata, please let us know by using the 'report' button and we will flag it for consideration.)
Students are asked to make a general hypothesis about whether Atlantic hurricane …
Students are asked to make a general hypothesis about whether Atlantic hurricane have been changing over time in response to recent climate change. It is expected that at an introductory level with only the most basic background instruction, students will focus on numbers, locations, or intensities of hurricanes. Example hypotheses might be
The numbers of hurricanes are increasing (or decreasing) Hurricanes are becoming more intense Hurricanes are forming in new locations Hurricane season is lengthening
They are then asked to develop more pointed questions that they can test. Some example questions for each hypothesis are given below:
Hypothesis 1 might lead to questions like "More hurricanes (or tropical storms) are forming each year" or "More hurricanes are striking land each year." Hypothesis 2 might lead to questions such as "The maximum wind speed for hurricanes is increasing" or "The minimum barometric pressure is decreasing." Hypothesis 3 might lead to questions like "Hurricanes are forming further north." Hypothesis 4 might lead to questions such as "Hurricanes are forming earlier and later."
To answer these questions would require students to understand some background about hurricanes, like how many typically occur in the past (which leads to questions about data collection and observing hurricanes), how hurricane intensity is measured, or at what latitudes hurricanes typically form.
Then they are given a table or map data (derived from NOAA GIS data of hurricane tracks and intensity) to test their hypotheses.
The results of their inquiries and data collection will be shared with the class as parts of small groups initially, and will culminate as a small group presentation.
(Note: this resource was added to OER Commons as part of a batch upload of over 2,200 records. If you notice an issue with the quality of the metadata, please let us know by using the 'report' button and we will flag it for consideration.)
Schrauben lösen, Kabel neu verlegen: Messer, Gabel und Pudelmütze werden zum Input …
Schrauben lösen, Kabel neu verlegen: Messer, Gabel und Pudelmütze werden zum Input für den Computer. Ziel ist es, neue Benutzerschnittstellen für den Computer zu entwickeln, indem die TeilnehmerInnen einen Blick "unter die Motorhaube" einer USB-Tastatur werfen. So können Jugendliche im Alter von 13 - 17 Jahren erste Schritte im kreativen Umgang mit Elektronik machen und dabei viel Spaß haben.
Voraussetzungen sind lediglich die Freude am Experimentieren und die Neugier, technologische Grundlagen spielerisch zu erlernen.
Students measuring elevations in a model map area. Provenance: Lynne Elkins, University …
Students measuring elevations in a model map area.
Provenance: Lynne Elkins, University of Nebraska at Lincoln Reuse: This item is offered under a Creative Commons Attribution-NonCommercial-ShareAlike license http://creativecommons.org/licenses/by-nc-sa/3.0/ You may reuse this item for non-commercial purposes as long as you provide attribution and offer any derivative works under a similar license. This exercise was designed in a department that has some basic support for developing inexpensive classroom equipment in cooperation with a machine shop. The shop built gridded mapping frames to my specifications using a simple aluminum design (a square frame of aluminum with small pins inserted at one-inch intervals). An even simpler DIY design could use thin but sturdy pieces of wood to create a wooden frame, with steel nails. My initial design called for 2'x2' frames, which turned out to be too large: mapping a 4 sq. ft. space at 1-inch resolution took more than a standard lab period for most students to complete. The attached exercise instructs students to use a smaller portion of the mapping grid; this can be revised for different size grids. Another issue to be aware of when designing mapping grid frames is whether to label the spaces with letters and numbers (as is done on many maps and was thus my original thinking) or to label the lines between the spaces, which is easier for data collection.
At the start of the lab, I typically give my students a few ground rules: they should avoid extremely flat areas, because the elevation rounding they are likely to do will make contouring them very difficult; their highest point should be at least 2 inches and not more than 4-5 inches high; they may not have vertical walls or overhangs (and should really keep the slopes less than 60-70Â at their steepest); the table surface is sea level with zero elevation; and most of their model area must be mappable land (not ocean, i.e. bare table). I give them large sheets of wax paper to construct the model on, for easy cleanup. I also provide large sheets of 1" grid paper so they can create a 1:1 map of their model (and I impose a scale calculation later for the model), and remind them several times not to invert the map labels when setting up their map grid. Typically this is all they need to know to begin creating and mapping a landscape. The mapping tools are pieces of string (to string across the pins on the mapping frames and position the grid points) and wooden skewers labeled with quarter-inch markings.
After an initial attempt to make the playdough for this lab, my department opted to purchase 6-lb. tubs of commercial playdough. It is ultimately relatively inexpensive because it is reusable almost indefinitely, as long as it is stored tightly sealed (we use zip-loc bags inside the commercial containers) and occasionally spritzed with water--once a year usually works fine for keeping it hydrated for storage over the rest of the year, but that may vary with climate and frequency of use. Typically I walk around while they are getting started and make commentary on their landscapes, and then when there are no further questions I go to the board and create an example data set and contour map. While a photocopied paper example map would accomplish the same thing, this approach lets me tailor my examples to what I see they are doing (e.g., including circular depressions, saddles, or ridges). I also have handy and frequently refer the students to USGS quads from around the country when they are mapping, e.g. a very flat quad with depressions in central Florida and a very steep quad from the Grand Canyon.
When they are mapping, I typically advise them to 1) sketch in the shoreline around their zero-elevation values by comparing to the model, 2) add major peaks between grid lines as needed, and 3) map from the highest parts of their map area downward. I also discourage contour intervals smaller than 1/2-inch, particularly when their model contains flat terrain. Many students want to be more precise, and if they have estimated depths to the nearest 1/8-inch it is possible to contour at 1/4-inch intervals, but typically their rounded measurements in flat areas make this quite tricky. It often is necessary for me (and/or TAs) to walk around and give them advice in places they are stuck and remind them how contours work.
Making the profile is usually very quick. The graph provided would need to be adjusted/replaced for different size mapping grids, but works well for a grid that runs from A to O on one side and from 1 to 10+ on the other.
If they are kept on task everyone except the most cautious or disorganized groups can typically finish elevation measurements for about 2 sq. ft. of map area within 1.5 hours. With an introductory spiel, that leaves about an hour for finishing most of the contouring and transferring data for the profile. Faster groups will probably finish all the final details but are well-advised to take the lab home to double check the details. Slower groups may finish coloring and looking at the local topo map on their own. Longer lab periods would permit a more detailed study of the local USGS maps and/or a larger model size--this was written for a 3-hour lab period.
(Note: this resource was added to OER Commons as part of a batch upload of over 2,200 records. If you notice an issue with the quality of the metadata, please let us know by using the 'report' button and we will flag it for consideration.)
Simple budgets may be used to estimate the exchange of water in …
Simple budgets may be used to estimate the exchange of water in embayments that capitalize on the concept of steady state and conservation principals. This is especially true for bays that experience a significant exchange of freshwater. This exchange of freshwater may reduce the average salt concentration in the bay compared to seawater if it involves addition of freshwater from rivers, R, and/or precipitation, P. Alternatively, it may increase the average salt concentration in the bay compared to seawater if there is relatively little river input and high evaporation, E. Since freshwater input changes the salt concentration in the bay, and salt is a conservative material, it is possible to combine two steady state budgets for a bay, one for salt and one for water, to solve for the magnitude of the water flows that enter and exit the bay mouth. Students will make actual calculations for the inflow and outflow of water to Puget Sound, Washington and the Mediterranean Sea and compare them to actual measured values.
(Note: this resource was added to OER Commons as part of a batch upload of over 2,200 records. If you notice an issue with the quality of the metadata, please let us know by using the 'report' button and we will flag it for consideration.)
In this assignment, students use Google Earth to investigate a variety of …
In this assignment, students use Google Earth to investigate a variety of fluvial and glacial features. Firstly, they simply have to find an example of both a meandering and braided river and cut-and-paste the image into their assignment. They also need to trace the path of the river to see where it ends. Next, they are given three latitude/longitude coordinates and are asked to determine the river type, channel width, floodplain width, gradient, etc. In the last part, they are given the latitude/longitude coordinates of two valleys. They use the terrain & tilt features of Google Earth to determine whether the valley is V- or U-shaped. They then decide what sort of processes is responsible for the valley's shape.
(Note: this resource was added to OER Commons as part of a batch upload of over 2,200 records. If you notice an issue with the quality of the metadata, please let us know by using the 'report' button and we will flag it for consideration.)
The is a curriculum module from the project Data Sets and Inquiry …
The is a curriculum module from the project Data Sets and Inquiry in Geoscience Education (DIGS). The module consists of a week-long unit and two-day performance assessment in which students apply the inquiry skills to problem-based investigations of urban micro-climates. The unit and performance assessment present semi-parallel tasks but about different cities (Phoenix and Chicago).
Sudents draw conclusions about the extent to which multiple decades of temperature data about Phoenix suggest that a shift in local climate is taking place as opposed to exhibiting nothing more than natural variability. The data are from the Global Climate Historical Network (GHCN) database. GHCN is a large, multi-year, international project to measure temperature, precipitation, and air pressure from near the ground. Each monthly maximum and minimum temperature is the highest and lowest temperature reading for the month, measured in Celsius. In Phoenix and in most other places, the temperature data are collected at local airports. The performance assessment for this module requires that students apply the methods and findings from the investigation of the climate data for Phoenix to climate data for Chicago. The Chicago data shows less evidence of trends in temperature change, and this is most evident comparing the night-time minimum temperature fluctuations between the two cities. Chicago also exhibits less increase in urban development and population growth than does Phoenix. In contrast to the curriculum unit, which primarily uses constructed-response tasks to encourage student explanation and discussion, the climate assessment tasks pose explicit selected- and constructed-response questions to ensure that the items elicit the intended thinking and hence provide evidence of the targeted standards-aligned skills and understandings.
(Note: this resource was added to OER Commons as part of a batch upload of over 2,200 records. If you notice an issue with the quality of the metadata, please let us know by using the 'report' button and we will flag it for consideration.)
No restrictions on your remixing, redistributing, or making derivative works. Give credit to the author, as required.
Your remixing, redistributing, or making derivatives works comes with some restrictions, including how it is shared.
Your redistributing comes with some restrictions. Do not remix or make derivative works.
Most restrictive license type. Prohibits most uses, sharing, and any changes.
Copyrighted materials, available under Fair Use and the TEACH Act for US-based educators, or other custom arrangements. Go to the resource provider to see their individual restrictions.