Biology is designed for multi-semester biology courses for science majors. It is …
Biology is designed for multi-semester biology courses for science majors. It is grounded on an evolutionary basis and includes exciting features that highlight careers in the biological sciences and everyday applications of the concepts at hand. To meet the needs of today’s instructors and students, some content has been strategically condensed while maintaining the overall scope and coverage of traditional texts for this course. Instructors can customize the book, adapting it to the approach that works best in their classroom. Biology also includes an innovative art program that incorporates critical thinking and clicker questions to help students understand—and apply—key concepts.
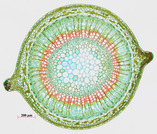
By the end of this section, you will be able to:Describe the …
By the end of this section, you will be able to:Describe the main function and basic structure of stemsCompare and contrast the roles of dermal tissue, vascular tissue, and ground tissueDistinguish between primary growth and secondary growth in stemsSummarize the origin of annual ringsList and describe examples of modified stems
Students learn about complex networks and how to represent them using graphs. …
Students learn about complex networks and how to represent them using graphs. They also learn that graph theory is a useful mathematical tool for studying complex networks in diverse applications of science and engineering, such as neural networks in the brain, biochemical reaction networks in cells, communication networks, such as the internet, and social networks. Topics covered include set theory, defining a graph, as well as defining the degree of a node and the degree distribution of a graph.
Students use graph theory to create social graphs for their own social …
Students use graph theory to create social graphs for their own social networks and apply what learn to create a graph representing the social dynamics found in a dramatic text. Students then derive meaning based on what they know about the text from the graphs they created. Students learn graph theory vocabulary, as well as engineering applications of graph theory.
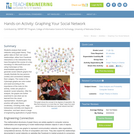
Students analyze their social networks using graph theory. They gather data on …
Students analyze their social networks using graph theory. They gather data on their own social relationships, either from Facebook interactions or the interactions they have throughout the course of a day, recording it in Microsoft Excel and using Cytoscape (a free, downloadable application) to generate social network graphs that visually illustrate the key persons (nodes) and connections between them (edges). The nodes in the Cytoscape graphs are color-coded and sized according to the importance of the node (in this activity, nodes are people in students' social networks). After the analysis, the graphs are further examined to see what can be learned from the visual representation. Students gain practice with graph theory vocabulary, including node, edge, betweeness centrality and degree on interaction, and learn about a range of engineering applications of graph theory.
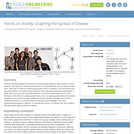
Students simulate disease transmission by collecting data based on their proximity to …
Students simulate disease transmission by collecting data based on their proximity to other students. One option for measuring proximity is by having Bluetooth devices "discover" each other. After data is collected, students apply graph theory to analyze it, and summarize their data and findings in lab report format. Students learn real-world engineering applications of graph theory and see how numerous instances of real-world relationships can be more thoroughly understood by applying graph theory. Also, by applying graph theory the students are able to come up with possible solutions to limit the spread of disease. The activity is intended to be part of a computer science curriculum and knowledge of the Java programming language is required. To complete the activity, a computer with Java installed and appropriate editing software is needed.
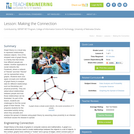
Graph theory is a visual way to represent relationships between objects. One …
Graph theory is a visual way to represent relationships between objects. One of the simplest uses of graph theory is a family tree that shows how different people are related. Another application is social networks like Facebook, where a network of "friends" and their "friends" can be represented using graphs. Students learn and apply concepts and methods of graph theory to analyze data for different relationships such as friendships and physical proximity. They are asked about relationships between people and how those relationships can be illustrated. As part of the lesson, students are challenged to find the social graph of their friends. This prepares students for the associated activity during which they simulate and analyze the spread of disease using graph theory by assuming close proximity to an infected individual causes the disease to spread.
Building on their understanding of graphs, students are introduced to random processes …
Building on their understanding of graphs, students are introduced to random processes on networks. They walk through an illustrative example to see how a random process can be used to represent the spread of an infectious disease, such as the flu, on a social network of students. This demonstrates how scientists and engineers use mathematics to model and simulate random processes on complex networks. Topics covered include random processes and modeling disease spread, specifically the SIR (susceptible, infectious, resistant) model.
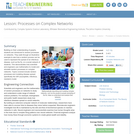
To get a better understanding of complex networks, students create their own, …
To get a better understanding of complex networks, students create their own, real social network example by interacting with their peers in the classroom and documenting the interactions. They represent the interaction data as a graph, calculate two mathematical quantities associated with the graph—the degree of each node and the degree distribution of the graph—and analyze how these quantities can be used to infer properties of the social network at hand.
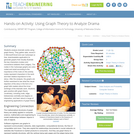
Students analyze dramatic works using graph theory. They gather data, record it …
Students analyze dramatic works using graph theory. They gather data, record it in Microsoft Excel and use Cytoscape (a free, downloadable application) to generate graphs that visually illustrate the key characters (nodes) and connections between them (edges). The nodes in the Cytoscape graphs are color-coded and sized according to the importance of the node (in this activity nodes represent characters in the work and their relative importance to the story). After the analysis, the graphs are further examined to see what the visual depiction of the story in the form of a graph tells readers about the inner workings of the dramatic work. Students gain practice with graph theory vocabulary, including node, edge, betweeness centrality and degree on interaction, and learn about a range of engineering applications of graph theory.
Students measure the wavelength of sounds and learn basic vocabulary associated with …
Students measure the wavelength of sounds and learn basic vocabulary associated with waves. As a class, they brainstorm the difference between two tuning forks and the sounds they produce. Then they come up with a way to measure that difference. Using a pipe in a graduated cylinder filled with water, students measure the wavelength of various tuning forks by finding the height the pipe must be held at to produce the loudest note. After calculating the wavelength and comparing it to the pitch of each tuning fork, students discover the relationship between wavelength and pitch.
No restrictions on your remixing, redistributing, or making derivative works. Give credit to the author, as required.
Your remixing, redistributing, or making derivatives works comes with some restrictions, including how it is shared.
Your redistributing comes with some restrictions. Do not remix or make derivative works.
Most restrictive license type. Prohibits most uses, sharing, and any changes.
Copyrighted materials, available under Fair Use and the TEACH Act for US-based educators, or other custom arrangements. Go to the resource provider to see their individual restrictions.