September is a great time for data collection activities as students are …
September is a great time for data collection activities as students are naturally curious about their new classmates. Ask questions that require students to analyze data and support their conclusions.
This 10-day module builds on Grade 2 concepts about data, graphing, and …
This 10-day module builds on Grade 2 concepts about data, graphing, and line plots. The two topics in this module focus on generating and analyzing categorical and measurement data. By the end of the module, students are working with a mixture of scaled picture graphs, bar graphs, and line plots to problem solve using both categorical and measurement data.
Find the rest of the EngageNY Mathematics resources at https://archive.org/details/engageny-mathematics.
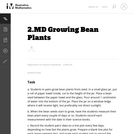
This task adds some rigor to the activity of growing bean plants. …
This task adds some rigor to the activity of growing bean plants. By collecting growth data, students practice measuring and recording length measurements.
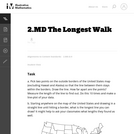
In this task students figure out how to draw the longest line …
In this task students figure out how to draw the longest line on a map of the United States without hitting a border. They use color and line plots to keep track of their results.
Distributions and Variability Type of Unit: Project Prior Knowledge Students should be …
Distributions and Variability
Type of Unit: Project
Prior Knowledge
Students should be able to:
Represent and interpret data using a line plot. Understand other visual representations of data.
Lesson Flow
Students begin the unit by discussing what constitutes a statistical question. In order to answer statistical questions, data must be gathered in a consistent and accurate manner and then analyzed using appropriate tools.
Students learn different tools for analyzing data, including:
Measures of center: mean (average), median, mode Measures of spread: mean absolute deviation, lower and upper extremes, lower and upper quartile, interquartile range Visual representations: line plot, box plot, histogram
These tools are compared and contrasted to better understand the benefits and limitations of each. Analyzing different data sets using these tools will develop an understanding for which ones are the most appropriate to interpret the given data.
To demonstrate their understanding of the concepts, students will work on a project for the duration of the unit. The project will involve identifying an appropriate statistical question, collecting data, analyzing data, and presenting the results. It will serve as the final assessment.
Lesson OverviewStudents complete a card sort that requires them to match sets …
Lesson OverviewStudents complete a card sort that requires them to match sets of statistics with the corresponding line plots.Students match cards with simple line plots to the corresponding card with measures of center. Some cards include mode, mean, median, and range, and some have one or two measures missing. Students discuss how they determined which cards would match.Key ConceptsTo complete the card sort in this lesson efficiently, students must be able to relate statistical measures with line plots. If they start with the measures that are easy to see, they can narrow down the possible matches.The mode is the easiest measure to see immediately. It is simply the number with the tallest column of dots.The range can be found easily by subtracting the least value in the plot from the greatest.The median can be found fairly quickly by counting to the middle dot or by pairing dots on the ends until reaching the middle.The mean must be calculated by adding data values and dividing.Goals and Learning ObjectivesApply knowledge of measures of center and range to solve problems.Discuss and review strategy choices when problem solving.
(Nota: Esta es una traducción de un recurso educativo abierto creado por …
(Nota: Esta es una traducción de un recurso educativo abierto creado por el Departamento de Educación del Estado de Nueva York (NYSED) como parte del proyecto "EngageNY" en 2013. Aunque el recurso real fue traducido por personas, la siguiente descripción se tradujo del inglés original usando Google Translate para ayudar a los usuarios potenciales a decidir si se adapta a sus necesidades y puede contener errores gramaticales o lingüísticos. La descripción original en inglés también se proporciona a continuación.)
Este módulo de 10 días se basa en conceptos de grado 2 sobre datos, gráficos y parcelas de línea. Los dos temas en este módulo se centran en generar y analizar datos categóricos y de medición. Al final del módulo, los estudiantes están trabajando con una mezcla de gráficos de imágenes escalados, gráficos de barras y gráficos de línea para resolver problemas utilizando datos categóricos y de medición.
Encuentre el resto de los recursos matemáticos de Engageny en https://archive.org/details/engageny-mathematics.
English Description: This 10-day module builds on Grade 2 concepts about data, graphing, and line plots. The two topics in this module focus on generating and analyzing categorical and measurement data. By the end of the module, students are working with a mixture of scaled picture graphs, bar graphs, and line plots to problem solve using both categorical and measurement data.
Find the rest of the EngageNY Mathematics resources at https://archive.org/details/engageny-mathematics.
No restrictions on your remixing, redistributing, or making derivative works. Give credit to the author, as required.
Your remixing, redistributing, or making derivatives works comes with some restrictions, including how it is shared.
Your redistributing comes with some restrictions. Do not remix or make derivative works.
Most restrictive license type. Prohibits most uses, sharing, and any changes.
Copyrighted materials, available under Fair Use and the TEACH Act for US-based educators, or other custom arrangements. Go to the resource provider to see their individual restrictions.