By the end of this section, you will be able to:Explain what …
By the end of this section, you will be able to:Explain what a correlation coefficient tells us about the relationship between variablesRecognize that correlation does not indicate a cause-and-effect relationship between variablesDiscuss our tendency to look for relationships between variables that do not really existExplain random sampling and assignment of participants into experimental and control groupsDiscuss how experimenter or participant bias could affect the results of an experimentIdentify independent and dependent variables
Students learn how the aerodynamics and rolling resistance of a car affect …
Students learn how the aerodynamics and rolling resistance of a car affect its energy efficiency through designing and constructing model cars out of simple materials. As the little cars are raced down a tilted track (powered by gravity) and propelled off a ramp, students come to understand the need to maximize the energy efficiency of their cars. The most energy-efficient cars roll down the track the fastest and the most aerodynamic cars jump the farthest. Students also work with variables and plot how a car's speed changes with the track angle.
This course is designed to provide students with a broad overview of …
This course is designed to provide students with a broad overview of the major theories on the relationship between ethnicity and politics. The course is divided into three sections. The first covers general theory and discusses the social construction of ethnicity as well as the limits of construction. The second section discusses ethnicity as a dependent variable. This section studies the forces that shape the development of ethnic identities and their motivating power. The third section addresses ethnicity as an independent variable. In other words, it focuses on how ethnicity operates to affect important political and economic outcomes. This course is the first semester of a year-long sequence on ethnic politics. However, each semester is self-contained and students may take the course in either or both semesters. Ethnic Politics I aims for breadth over depth. It covers many works in the “canon” of texts on ethnic politics as well as addressing many major topics (modernization, entrepreneurship, prejudice, ethnic party formation, etc.) in one week sessions. Ethnic Politics II covers some of these topics in greater depth and also requires a major research paper.
Use this activity to explore forces acting on objects, practice graphing experimental …
Use this activity to explore forces acting on objects, practice graphing experimental data, and introduce the algebra concepts of slope and intercept of a line. A wooden 2 x 4 beam is set on top of two scales. Students learn how to conduct an experiment by applying loads at different locations along the beam, recording the exact position of the applied load and the reaction forces measured by the scales at each end of the beam. In addition, students analyze the experiment data with the use of a chart and a table, and model/graph linear equations to describe relationships between independent and dependent variables.
In this 2-part inquiry-based lesson, students conduct a literature search to determine …
In this 2-part inquiry-based lesson, students conduct a literature search to determine the characteristics of the atmospheres of different planets (Venus, Mercury, Mars and Earth). After collecting and analyzing data, student teams design and conduct a controlled physical experiment using a lab apparatus to learn about the interaction of becomes CO², air, and temperature. The resource includes student worksheets, a design proposal, and student questions. Connections to contemporary climate change are addressed. This lesson is the first of four in Topic 4, "How do Atmospheres Affect Planetary Temperatures?" within the resource, Earth Climate Course: What Determines a Planet's Climate?
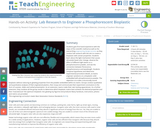
Students gain first-hand experience with the steps of the scientific method as …
Students gain first-hand experience with the steps of the scientific method as well as the overarching engineering design process as they conduct lab research with the aim to create a bioplastic with certain properties. Students learn about the light mechanism that causes ultraviolet bead color change, observe the effect of different light waves on a phosphorescence powder, and see the connection between florescence, phosphorescence and wavelength. Students compose hypotheses and determine experimental procedure details, as teams engineer variations on a bioplastic solid embedded with phosphorescence powder. The objective is to make a structurally sound bioplastic without reducing its glowing properties from the powder embedded within its matrix. Groups conduct qualitative and quantitative analyses of their engineered plastics, then recap and communicate their experiment conclusions in the form of a poster, slides and verbal presentation. As an extension, teams make their own testing apparatuses. As a further extension, they combine all the group results to determine which bioplastic matrix best achieves the desired properties and then “manufacture” the optimum bioplastic into glowing toy figurine end products! Many handouts, instructions, photos and rubrics are provided.
Students design, build and test model race cars made from simple materials …
Students design, build and test model race cars made from simple materials (lifesaver-shaped candies, plastic drinking straws, Popsicle sticks, index cards, tape) as a way to explore independent, dependent and control variables. They measure the changes in distance travelled with the addition of mass to the vehicles. Students also practice the steps of the engineering design process by brainstorming, planning, building, testing, and improving their "mint-mobiles."
In this activity, student teams design small-scale physical models of hot and …
In this activity, student teams design small-scale physical models of hot and cold planets, (Venus and Mars), and learn that small scale models allow researchers to determine how much larger systems function. There is both a team challenge and competition built into this activity. Experimental findings are then used to support a discussion of human outposts on Mars. The resource includes an experimental design guide for students as well as a handout outlining a method for the design of controlled experiments, and student data sheets. Student questions and an essay assignment are provided as classroom assessments. This is Activity A in the second module, titled "Modeling hot and cold planets," of the resource, "Earth Climate Course: What Determines a Planet's Climate?" The course aims to help students to develop an understanding of our environment as a system of human and natural processes that result in changes that occur over various space and time scales.
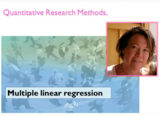
An introduction and examples of how to use Multiple linear regression. The …
An introduction and examples of how to use Multiple linear regression. The Linear regression model investigates a linear relationship. The dependent variable should be quantitative and normally distributed. The Multiple Regression Model includes more than one independent variable. The Multiple Regression Model is introduced with real data from the Swedish pregnancy register.
Students conduct an experiment to determine how varying the composition of a …
Students conduct an experiment to determine how varying the composition of a construction material affects its strength. They make several adobe bricks with differing percentages of sand, soil, fibrous material and water. They test the bricks for strength by dropping them onto a concrete surface from progressively greater heights. Students graph the experiment results and use what they learn to design their own special mix that maximizes the bricks' strength. During the course of the experiment, students learn about variables (independent, dependent, control) and the steps of the engineering design process.
An introduction and examples of how to use the basic ideas and …
An introduction and examples of how to use the basic ideas and steps in logistic regression and Cox regression. Regression is about trying to explain phenomena in reality by constructing a mathematical model that describes reality.
Psychology is designed to meet scope and sequence requirements for the single-semester …
Psychology is designed to meet scope and sequence requirements for the single-semester introduction to psychology course. The book offers a comprehensive treatment of core concepts, grounded in both classic studies and current and emerging research. The text also includes coverage of the DSM-5 in examinations of psychological disorders. Psychology incorporates discussions that reflect the diversity within the discipline, as well as the diversity of cultures and communities across the globe.Senior Contributing AuthorsRose M. Spielman, Formerly of Quinnipiac UniversityContributing AuthorsKathryn Dumper, Bainbridge State CollegeWilliam Jenkins, Mercer UniversityArlene Lacombe, Saint Joseph's UniversityMarilyn Lovett, Livingstone CollegeMarion Perlmutter, University of Michigan
By the end of this section, you will be able to:Explain what …
By the end of this section, you will be able to:Explain what a correlation coefficient tells us about the relationship between variablesRecognize that correlation does not indicate a cause-and-effect relationship between variablesDiscuss our tendency to look for relationships between variables that do not really existExplain random sampling and assignment of participants into experimental and control groupsDiscuss how experimenter or participant bias could affect the results of an experimentIdentify independent and dependent variables
By the end of this section, you will be able to:Explain what …
By the end of this section, you will be able to:Explain what a correlation coefficient tells us about the relationship between variablesRecognize that correlation does not indicate a cause-and-effect relationship between variablesDiscuss our tendency to look for relationships between variables that do not really existRecognize how correlations coefficients tell us about the relationships between variables specific to selection methods.
Students take an in-depth look at what goes into planning a research …
Students take an in-depth look at what goes into planning a research project, which prepares them to take the lead on their own projects. Examining a case study, students first practice planning a research project that compares traditional cook stoves to improved cook stoves for use in the developing world. Then they compare their plans to one used in the real-world by professional researchers, gaining perspective and details on the thought and planning that goes into good research work. Then students are provided with example materials, a blank template and support to take them from brainstorming to completing a detailed research plan for their own air quality research projects. Conducting students’ AQ-IQ research studies requires additional time and equipment beyond this planning activity. Then after the data is collected and analyzed, teams interpret the data and present summary research posters by conducting the next associated activity Numerous student handouts and a PowerPoint® presentation are provided.
In this activity, student teams learn about research design and design a …
In this activity, student teams learn about research design and design a controlled experiment exploring the relationship between a hypothetical planet, an energy source, and distance. They analyze the data and derive an equation to describe the observations. Includes student data sheets, a teacher's guide, and a tutorial on how to use the spreadsheet program Excel. This is Activity A in module 3, titled "Using Mathematic Models to Investigate Planetary Habitability," of the resource, Earth Climate Course: What Determines a Planet's Climate? The course aims to help students to develop an understanding of our environment as a system of human and natural processes that result in changes that occur over various space and time scales.
Students learn how to quickly and efficiently interpret graphs, which are used …
Students learn how to quickly and efficiently interpret graphs, which are used for everyday purposes as well as engineering analysis. Through a practice handout completed as a class and a worksheet completed in small groups, students gain familiarity in talking about and interpreting graphs. They use common graph terminology such as independent variable, dependent variable, linear data, linear relationship and rate of change. The equation for calculating slope is explained. The focus is on students becoming able to clearly describe linear relationships by using the language of slope and the rate of change between variables. At lesson end, students discuss the relationship between variables as presented by the visual representation of a graph. Then they independently complete a homework handout.
No restrictions on your remixing, redistributing, or making derivative works. Give credit to the author, as required.
Your remixing, redistributing, or making derivatives works comes with some restrictions, including how it is shared.
Your redistributing comes with some restrictions. Do not remix or make derivative works.
Most restrictive license type. Prohibits most uses, sharing, and any changes.
Copyrighted materials, available under Fair Use and the TEACH Act for US-based educators, or other custom arrangements. Go to the resource provider to see their individual restrictions.