Updating search results...

Search Resources

12 Results

View
Selected filters:
  • data-set
ASL-LEX: A Lexical Database of American Sign Language
Conditional Remix & Share Permitted
CC BY-NC
Rating
0.0 stars

ASL-LEX is a database of lexical and phonological properties of American Sign Language signs. It was first released in 2016 with nearly 1,000 signs. ASL-LEX was updated in Fall 2020 with greatly expanded information and an increased size of 2,723 signs.

ASL-LEX is available as a searchable web interface and as raw data in spreadsheet form. This website hosts the web visualization and provides instructions for how to use and download the database.

Subject:
Arts and Humanities
Languages
Material Type:
Data Set
Author:
Karen Emmorey
Naomi Casselli
et al.
ASL-LEX
Date Added:
12/23/2021
Does your sleep deficit impact your life?
Conditional Remix & Share Permitted
CC BY-NC
Rating
0.0 stars

In this problem-based learning module, students will explore the importance of sleep and the impact sleep has on their lives.  During the launch phase students can choose to record sleep data via downloaded apps or in a sleep diary.  Days 2 through 4 have students explore the concept and necessity of living organisms need to sleep. On day 2 the participants will take a series of cognitive test for baseline data.  Through station rotation and a jigsaw activity learners will become familiar with circadian rhythm and sleeping disorders. Finally, days 5-7 have the students produce a video or infographic to communicate the importance of sleep and its relationship to performance both physically and academically.

Subject:
English Language Arts
Life Science
Mathematics
Material Type:
Lesson Plan
Author:
Blended Learning Teacher Practice Network
Date Added:
07/27/2018
Essentials of Oceanography
Conditional Remix & Share Permitted
CC BY-NC-SA
Rating
0.0 stars

The year is 2050 and your once-idyllic beachfront vacation home is now flooded up to the second story. The crab your family has enjoyed every Christmas for as long as you can remember has now become an endangered species. The oceans have changed. In Earth 540, Oceanography for Educators, we explore the mechanisms that lead to sea level rise and ocean acidification. We strive to understand how natural processes such as ocean currents, the gulf-stream, tides, plate tectonics, and the Coriolis Effect, affect our oceans and ocean basins. We then predict how man-made issues such as climate change and overfishing will affect our beloved waters and our livelihoods. Want to see into the future? Then this course is for you!

Subject:
Oceanography
Physical Science
Material Type:
Textbook
Provider:
LibreTexts
Author:
Eliza Richardson
Date Added:
02/02/2022
Introduction to Climate Science
Conditional Remix & Share Permitted
CC BY-NC
Rating
0.0 stars

Short Description:
This book describes how Earth's climate is changing, how it has been changing in the recent geological past and how it may change in the future. It covers the physical sciences that build the foundations of our current understanding of global climate change such as radiation, Earth's energy balance, the greenhouse effect and the carbon cycle. Both natural and human causes for climate change are discussed. Impacts of climate change on natural and human systems are summarized. Ethical and economical aspects of human-caused climate change and solutions are presented. Data dashboard

Word Count: 52328

(Note: This resource's metadata has been created automatically by reformatting and/or combining the information that the author initially provided as part of a bulk import process.)

Subject:
Applied Science
Atmospheric Science
Career and Technical Education
Environmental Science
Environmental Studies
Oceanography
Physical Science
Material Type:
Textbook
Provider:
Oregon State University
Author:
Andreas Schmittner
Date Added:
05/28/2018
Learn Science
Rating
0.0 stars

NASA Wavelength is a collection of resources that incorporate NASA content and have been subject to peer review. You can search this collection using key words and/or the drop down menus to pinpoint resources to use with your audience of learners. Set Materials Cost dropdown to 'Free' before searching. Materials' copyright will vary.

Subject:
Astronomy
Physical Science
Material Type:
Activity/Lab
Homework/Assignment
Lesson
Reading
Author:
NASA
National Aeronautics and Space Administration
Date Added:
12/24/2021
Media Manipulation Casebook
Rating
0.0 stars

The Media Manipulation Casebook is a digital research platform linking together theory, methods, and practice for mapping media manipulation and disinformation campaigns. This resource is intended for researchers, journalists, technologists, policymakers, educators, and civil society organizers who want to learn about detecting, documenting, describing, and debunking misinformation, disinformation, and media manipulation.

Subject:
Business and Communication
Communication
Material Type:
Case Study
Reading
Author:
Dr. Joan Donovan
Date Added:
12/24/2021
NASA STEM for Students and Educators
Unrestricted Use
Public Domain
Rating
0.0 stars

Searchable database of resources and opportunities for students and educators. See Citizen Science opportunities for assignment and activity inspiration. See All Topics index in addition to the Educational Materials search.

Subject:
Astronomy
Physical Science
Material Type:
Activity/Lab
Case Study
Data Set
Lesson
Primary Source
Reading
Unit of Study
Author:
NASA
National Aeronautics and Space Administration
Date Added:
12/24/2021
Open Government at NASA
Unrestricted Use
Public Domain
Rating
0.0 stars

Open data, research, code, images, video, and resources. Also includes information on funding and policy. See Solve, Citizen Science, and COECI.

Subject:
Astronomy
Physical Science
Material Type:
Activity/Lab
Lesson
Primary Source
Reading
Unit of Study
Author:
NASA
National Aeronautics and Space Administration
Date Added:
12/24/2021
Principles of Microeconomics - 2021A
Conditional Remix & Share Permitted
CC BY-NC-SA
Rating
0.0 stars

Principles of Microeconomics is an adaptation of the textbook, Microeconomics: Markets, Methods, and Models by D. Curtis and I. Irvine, which provides concise yet complete coverage of introductory microeconomic theory, application and policy in a Canadian and global environment. This adaptation employs methods that use equations sparingly and do not utilize calculus. The key issues in most chapters are analyzed by introducing a numerical example or case study at the outset. Students are introduced immediately to the practice of taking a data set, examining it numerically, plotting it, and again analyzing the material in that form. The end-of-chapter problems involve numerical and graphical analysis, and a small number of problems in each chapter involve solving simple linear equations (intersecting straight lines). However, a sufficient number of questions is provided for the student to test understanding of the material without working through that subset of questions. This textbook is intended for a one-semester course, and can be used in a two-semester sequence with the companion textbook, Principles of Macroeconomics. The three introductory chapters are common to both textbooks.

Subject:
Economics
Social Science
Material Type:
Textbook
Provider:
BCcampus
Author:
Douglas Curtis
Ian Irvine
Lyryx Learning Team
Date Added:
12/25/2021
Resources: Data Management using National Ecological Observatory Network's (NEON) Small Mammal Data with Accompanying Lesson on Mark Recapture Analysis
Unrestricted Use
CC BY
Rating
0.0 stars

This version of this teaching module was published in Teaching Issues and Experiments in Ecology:

Jim McNeil and Megan A. Jones. April 2018, posting date. Data Management using National Ecological Observatory Network’s (NEON) Small Mammal Data with Accompanying Lesson on Mark Recapture Analysis. Teaching Issues and Experiments in Ecology, Vol. 13: Practice #9 [online]. http://tiee.esa.org/vol/v13/issues/data_sets/mcneil/abstract.html

*** *** ***

Undergraduate STEM students are graduating into professions that require them to manage and work with data at many points of a data management life cycle. Within ecology, students are presented not only with many opportunities to collect data themselves, but increasingly to access and use public data collected by others. This activity introduces the basic concept of data management from the field through to data analysis. The accompanying presentation materials mention the importance of considering long-term data storage and data analysis using public data.

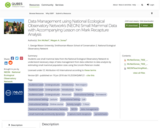
This data set is a subset of small mammal trapping data from the National Ecological Observatory Network (NEON). The accompanying lesson introduces students to proper data management practices including how data moves from collection to analysis. Students perform basic spreadsheet tasks to complete a Lincoln-Peterson mark-recapture calculation to estimate population size for a species of small mammal. Pairs of students will work on different sections of the datasets allowing for comparison between seasons or, if instructors download additional data, between sites and years. Data from six months at NEON’s Smithsonian Conservation Biology Institute (SCBI) field site are included in the materials download. Data from other years or locations can be downloaded directly from the NEON data portal to tailor the activity to a specific location or ecological topic.

In this activity, students will:

- discuss data management practices with the faculty. Presentation slides are provided to guide this discussion.
- view field collection data sheets to understand how organized data sheets can be constructed.
- design a spreadsheet data table for transcription of field collected data using good data management practices.
- view NEON small mammal trapping data to a) see a standardized spreadsheet data table and b) see what data are collected during NEON small mammal trapping.
- use Microsoft Excel or Google Sheets to conduct a simple Lincoln-Peterson Mark-Recapture analysis to estimate plot level species population abundance.

Please note that this lesson was developed while the NEON project was still in construction. There may be future changes to the format of collected and downloaded data. If using data directly from the NEON Data Portal instead of using the data sets accompanying this lesson, we recommend testing out the data each year prior to implementing this lesson in the classroom.

This module was originally taught starting with a field component where students accompanied NEON technicians during the small mammal trapping. As this is not a possibility for most courses, the initial part of the lesson has been modified to include optional videos that instructors can use to show how small mammal trapping is conducted. Instructors are also encouraged to bring small mammal traps and small mammal specimens into the classroom where available.

The Data Sets

The National Ecological Observatory Network is a program sponsored by the National Science Foundation and operated under cooperative agreement by Battelle Memorial Institute. This material is based in part upon work supported by the National Science Foundation through the NEON Program.

The following datasets are posted for educational purposes only. Data for research purposes should be obtained directly from the National Ecological Observatory Network (www.neonscience.org).

Data Citation: National Ecological Observatory Network. 2017. Data Product: NEON.DP1.10072.001. Provisional data downloaded from http://data.neonscience.org. Battelle, Boulder, CO, USA

Notes
Version 2.1: Includes correct Lincoln-Peterson Index formula in PPT, faculty, and student notes.

Version 2.0: This version of the teaching module was published in Teaching Issues and Experiments in Ecology. McNeil and Jones 2018. This version reflects updates based on comments from reviewers.

Version 1.0: This version of the teaching module was prepared as part of the 2017 DIG FMN. It was submitted for publication as part of the DIG Special Issue of TIEE.

Cite this work
Researchers should cite this work as follows:

Jim McNeil, Megan A. Jones (2018). Data Management using National Ecological Observatory Network's (NEON) Small Mammal Data with Accompanying Lesson on Mark Recapture Analysis. NEON - National Ecological Observatory Network, (Version 2.1). QUBES Educational Resources. doi:10.25334/Q4M121

Subject:
Applied Science
Information Science
Material Type:
Activity/Lab
Data Set
Primary Source
Author:
George Mason University Smithsonian-mason School Of Conservation
Jim Mcneil
Megan A
National Ecological Observatory Network
Date Added:
12/21/2021
Resources: Introduction to Data Management and Metadata using NEON aquatic macroinvertebrate data
Unrestricted Use
CC BY
Rating
0.0 stars

Description
This lesson introduces students to working with metadata, which can be broadly thought of as the data ABOUT existing data. Data isn’t complete without metadata, and this lesson will help students understand both how to work with metadata and how to create their own.

Data used: NEON aquatic macroinvertebrate datasets from multiple stations. It could be adapted to use any data sets or taxonomic groups though.

Activities: The lesson involves three major activities. 1) Querying and downloading datasets and corresponding products from NEON. 2) Reading and answering comprehension questions about metadata files that correspond with data files 3) Combining two datasets based off understanding the metadata in exercise 2 (e.g. understanding which columns indicate sampling dates and in which formats will allow them to appropriately combine multiple data sets).

Programs: No specific programming skills or language is required for this lesson. This lesson is designed to be done entirely in common office/student software programs (e.g. Microsoft Word and Microsoft Office) and could be done using online programs (e.g. my university has student licenses for Google Spreadsheets and Google Docs).

Learning objectives:

1 – Students will be able to define ‘metadata’ and understand how metadata is critical for reproducible research.

2 – Students will be able to correctly answer comprehension questions about a metadata file.

3 – Students will be able to apply their understanding of the metadata file to create a new data file from two data sets.

4 – Students will understand the importance of creating and understanding metadata to go along with datasets.

Timing: This lesson was designed to take place in two – 75 minute class periods that are in a workshop format. This lesson could easily be part of a longer lab, homework, or a remote / online / asynchronous assignment.

Notes
This version is current as of Spring 2019 and was classroom taught. I encourage folks to adapt, modify, and make new versions.

Cite this work
Researchers should cite this work as follows:

Whitney, K. S. (2019). Introduction to Data Management and Metadata using NEON aquatic macroinvertebrate data. NEON Faculty Mentoring Network, QUBES Educational Resources. doi:10.25334/SJX1-F373

Subject:
Applied Science
Information Science
Material Type:
Activity/Lab
Primary Source
Author:
Kaitlin Stack Whitney
Rochester Institute Of Technology
Date Added:
12/18/2021
Statistical Analysis of Temperature Sensors
Read the Fine Print
Educational Use
Rating
0.0 stars

Working as if they are engineers aiming to analyze and then improve data collection devices for precision agriculture, students determine how accurate temperature sensors are by comparing them to each other. Teams record soil temperature data during a class period while making changes to the samples to mimic real-world crop conditions—such as the addition of water and heat and the removal of the heat. Groups analyze their collected data by finding the mean, median, mode, and standard deviation. Then, the class combines all the team data points in order to compare data collected from numerous devices and analyze the accuracy of their recording devices by finding the standard deviation of temperature readings at each minute. By averaging the standard deviations of each minute’s temperature reading, students determine the accuracy of their temperature sensors. Students present their findings and conclusions, including making recommendations for temperature sensor improvements.

Subject:
Mathematics
Statistics and Probability
Material Type:
Activity/Lab
Provider:
TeachEngineering
Provider Set:
Activities
Author:
Keith Lehman
Northern Cass
Trent Kosel
Date Added:
06/28/2017