This resource can be used in providing real-life activity for students by conducting …
This resource can be used in providing real-life activity for students by conducting survey. Results of their survey will be organized and presented through text, graphs and tables with research ethics observed.
Intermediate students are asked to analyze data on the components of consumption …
Intermediate students are asked to analyze data on the components of consumption and investment expenditures and explanatory variables based on textbook models of each. Students look for rough correlations between the explanatory and dependent variables.
The applets in this section allow you to see how different bivariate …
The applets in this section allow you to see how different bivariate data look under different correlation structures. The Movie applet either creates data for a particular correlation or animates a multitude data sets ranging correlations from -1 to 1.
In this undergraduate research and service learning project, students and faculty collaborate …
In this undergraduate research and service learning project, students and faculty collaborate on a study of the effects of condemned/restored homes in their college town on surrounding property values. While this example describes an experience in a small, upper-level elective course, it includes suggestions for modifications of design and learning goals for other learning levels and environments.
The evolution of ideas is often ignored in the teaching of statistics. …
The evolution of ideas is often ignored in the teaching of statistics. It is important to show students how definitions and formulas evolve. This activity describes a fairly straightforward activity of how measures of association can evolve.
This text document lists detailed learning objectives for introductory statistics courses. Learning …
This text document lists detailed learning objectives for introductory statistics courses. Learning objectives are brief, clear statements of what learners will be able to perform at the end of a course.
This lesson unit is intended to help you assess how well students …
This lesson unit is intended to help you assess how well students are able to: Calculate the mean, median, mode, and range from a frequency chart; and to use a frequency chart to describe a possible data set, given information on the mean, median, mode, and range.
This activity helps students develop better understanding and stronger reasoning skills about …
This activity helps students develop better understanding and stronger reasoning skills about distributions in terms of center and spread. Key words: center, spread, distribution
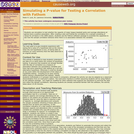
This activity uses simulation to help students understand sampling variability and reason …
This activity uses simulation to help students understand sampling variability and reason about whether a particular samples result is unusual, given a particular hypothesis. By using first candies, then a web applet, and varying sample size, students learn that larger samples give more stable and better estimates of a population parameter and develop an appreciation for factors affecting sampling variability.
This activity has students use Fathom to test the correlation between attendance …
This activity has students use Fathom to test the correlation between attendance and ballpark capacity of major league baseball teams by taking a sample of actual data and scrambling one of the variables to see how the correlation behaves when the variables are not related. After displaying the distribution of correlations for many simulated samples, students find an approximate p-value based on the number of simulations that exceed the actual correlation.
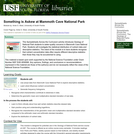
Spreadsheets Across the Curriculum/Geology of National Parks module. Students use the geometric …
Spreadsheets Across the Curriculum/Geology of National Parks module. Students use the geometric mean and multiplicative standard deviation to examine the right-skewed distribution of nutrient concentrations in water-quality data at Mammoth Cave National Park.
Dawson (1995) presented a data set giving a population at risk and …
Dawson (1995) presented a data set giving a population at risk and fatalities for an “unusual episode” (the sinking of the ocean liner Titanic) and discussed the use of the data set in a first statistics course as an elementary exercise in statistical thinking, the goal being to deduce the origin of the data. Simonoff (1997) discussed the use of this data set in a second statistics course to illustrate logistic regression. Moore (2000) used an abbreviated form of the data set in a chapter exercise on the chi-square test. This article describes an activity that illustrates contingency table (two-way table) analysis. Students use contingency tables to analyze the “unusual episode” data (from Dawson 1995) and attempt to use their analysis to deduce the origin of the data. The activity is appropriate for use in an introductory college statistics course or in a high school AP statistics course.
The activity begins with an explanation of the Caesar Shift for message …
The activity begins with an explanation of the Caesar Shift for message encryption (Singh, 1999). The Caesar Shift is a translation of the alphabet; for example, a five-letter shift would code the letter a as f, b as g, … z as e. We describe a five-step process for decoding an encrypted message. First, groups of size 4 construct a frequency table of the letters in two lines of a coded message. Second, students construct a bar chart for a reference message of the frequency of letters in the English language. Third, students create a bar chart of the coded message. Fourth, students visually compare the bar chart of the reference message (step 2) to the bar chart of the coded message (step 3). Based on this comparison, students hypothesize a shift. Fifth, students apply the shift to the coded message.
This activity provides students with 24 histograms representing distributions with differing shapes …
This activity provides students with 24 histograms representing distributions with differing shapes and characteristics. By sorting the histograms into piles that seem to go together, and by describing those piles, students develop awareness of the different versions of particular shapes (e.g., different types of skewed distributions, or different types of normal distributions), that not all histograms are easy to classify, that there is a difference between models (normal, uniform) and characteristics (skewness, symmetry, etc.).
As teachers of statistics, we know that residual plots and other diagnostics …
As teachers of statistics, we know that residual plots and other diagnostics are important to deciding whether or not linear regression is appropriate for a set of data. Despite talking with our students about this, many students might believe that if the correlation coefficient is strong enough, these diagnostic checks are not important. The data set included in this activity was created to lure students into a situation that looks on the surface to be appropriate for the use of linear regression but is instead based (loosely) on a quadratic function.
This activity is an advanced version of the “Keep your eyes on …
This activity is an advanced version of the “Keep your eyes on the ball” activity by Bereska, et al. (1999). Students should gain experience with differentiating between independent and dependent variables, using linear regression to describe the relationship between these variables, and drawing inference about the parameters of the population regression line. Each group of students collects data on the rebound heights of a ball dropped multiple times from each of several different heights. By plotting the data, students quickly recognize the linear relationship. After obtaining the least squares estimate of the population regression line, students can set confidence intervals or test hypotheses on the parameters. Predictions of rebound length can be made for new values of the drop height as well. Data from different groups can be used to test for equality of the intercepts and slopes. By focusing on a particular drop height and multiple types of balls, one can also introduce the concept of analysis of variance.
The activity is designed to help students develop a better intuitive understanding …
The activity is designed to help students develop a better intuitive understanding of what is meant by variability in statistics. Emphasis is placed on the standard deviation as a measure of variability. As they learn about the standard deviation, many students focus on the variability of bar heights in a histogram when asked to compare the variability of two distributions. For these students, variability refers to the variation in bar heights. Other students may focus only on the range of values, or the number of bars in a histogram, and conclude that two distributions are identical in variability even when it is clearly not the case. This activity can help students discover that the standard deviation is a measure of the density of values about the mean of a distribution and to become more aware of how clusters, gaps, and extreme values affect the standard deviation.
This group activity focuses on conducting an experiment to determine which of …
This group activity focuses on conducting an experiment to determine which of two brands of paper towels are more absorbent by measuring the amount of water absorbed. A two-sample t-test can be used to analyze the data, or simple graphics and descriptive statistics can be used as an exploratory analysis. Students are asked to think about design issues, and to write a short report stating their results and conclusions, along with an evaluation of the experimental design.
Christopher J. Malone, Christopher R. Bilder, Deborah J. Rumsey, John E. Boyer, Kansas State University, Ohio State University, Oklahoma State University
In this classroom project, students and faculty help a local housing non-profit …
In this classroom project, students and faculty help a local housing non-profit identify area U.S. Census tracts most in need of its assistance in promoting decent and affordable homeownership to low- to moderate- income individuals. While this example describes an experience in a small, upper-level elective economics course, it includes suggestions for modifications of design and learning goals for other learning levels and environments.
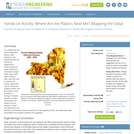
In a student-led and fairly independent fashion, data collected in the associated …
In a student-led and fairly independent fashion, data collected in the associated field trip activity are organized by student groups to create useful and informative Google Earth maps. Each team creates a map, uses that map to analyze the results, adjusts the map to include the analysis results, and then writes a brief summary of findings. Primarily, questions of fate-and-transport of plastics are are explored. If data was gathered in the field trip but the teacher does not desire to do the mapping activity, then alternative data presentation and analysis methods are suggested.
No restrictions on your remixing, redistributing, or making derivative works. Give credit to the author, as required.
Your remixing, redistributing, or making derivatives works comes with some restrictions, including how it is shared.
Your redistributing comes with some restrictions. Do not remix or make derivative works.
Most restrictive license type. Prohibits most uses, sharing, and any changes.
Copyrighted materials, available under Fair Use and the TEACH Act for US-based educators, or other custom arrangements. Go to the resource provider to see their individual restrictions.