Finding themselves in the middle of the Amazon rainforest after a plane …
Finding themselves in the middle of the Amazon rainforest after a plane crash, students use map scales, keys, and longitude and latitude coordinates to figure out where they are. Then they work in groups to generate ideas and make plans. They decide where they should go to be rescued, the distance to that location, the route to take, and make calculations to estimate walking travel time.
A brief refresher on the Cartesian plane includes how points are written …
A brief refresher on the Cartesian plane includes how points are written in (x, y) format and oriented to the axes, and which directions are positive and negative. Then students learn about what it means for a relation to be a function and how to determine domain and range of a set of data points.
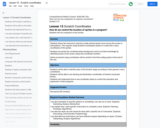
In this lesson, students find their location on a map using Latitude …
In this lesson, students find their location on a map using Latitude and Longitudinal coordinates. They determine where they should go to be rescued and how best to get there.
Geographic information systems (GIS), once used predominantly by experts in cartography and …
Geographic information systems (GIS), once used predominantly by experts in cartography and computer programming, have become pervasive in everyday business and consumer use. This unit explores GIS in general as a technology about which much more can be learned, and it also explores applications of that technology. Students experience GIS technology through the use of Google Earth on the environmental topic of plastics in the ocean in an area known as the Great Pacific Garbage Patch. The use of this topic in GIS makes the unit multidisciplinary, incorporating the physics of ocean currents, the chemistry associated with pollutant degradation and chemical sorption to organic-rich plastics, and ecological impact to aquatic biota.
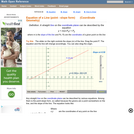
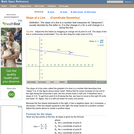
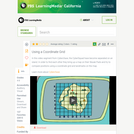
An interactive applet and associated web page that demonstrate the equation of …
An interactive applet and associated web page that demonstrate the equation of a line in point-slope form. The user can move a slider that controls the slope, and can drag the point that defines the line. The graph changes accordingly and equation for the line is continuously recalculated with every slider and / or point move. The grid, axis pointers and coordinates can be turned on and off. The equation display can be turned off to permit class exercises and then turned back on the verify the answers. The applet can be printed as it appears on the screen to make handouts. The web page has a full description of the concept of the equation of a line in point - slope form, a worked example and has links to other pages relating to coordinate geometry. Applet can be enlarged to full screen size for use with a classroom projector. This resource is a component of the Math Open Reference Interactive Geometry textbook project at http://www.mathopenref.com.
Students learn about the Foucault pendulum an engineering tool used to demonstrate …
Students learn about the Foucault pendulum an engineering tool used to demonstrate and measure the Earth's rotation. Student groups create small experimental versions, each comprised of a pendulum and a video camera mounted on a rotating platform actuated by a LEGO MINDSTORMS(TM) NXT motor. When the platform is fixed, the pendulum motion forms a line, as observed in the recorded video. When the rotating, the pendulum's motion is observed as a set of spirals with a common center. Observing the patterns that the pendulum bob makes when the platform is rotating provides insight as to how a full-size Foucault pendulum operates. It helps students understand some of the physical phenomena induced by the Earth's rotation, as well as the tricky concept of how the perception of movement varies, depending on one's frame of reference.
In this module, students explore and experience the utility of analyzing algebra …
In this module, students explore and experience the utility of analyzing algebra and geometry challenges through the framework of coordinates. The module opens with a modeling challenge, one that reoccurs throughout the lessons, to use coordinate geometry to program the motion of a robot that is bound within a certain polygonal region of the planethe room in which it sits. To set the stage for complex work in analytic geometry (computing coordinates of points of intersection of lines and line segments or the coordinates of points that divide given segments in specific length ratios, and so on), students will describe the region via systems of algebraic inequalities and work to constrain the robot motion along line segments within the region.
Find the rest of the EngageNY Mathematics resources at https://archive.org/details/engageny-mathematics.
(Nota: Esta es una traducción de un recurso educativo abierto creado por …
(Nota: Esta es una traducción de un recurso educativo abierto creado por el Departamento de Educación del Estado de Nueva York (NYSED) como parte del proyecto "EngageNY" en 2013. Aunque el recurso real fue traducido por personas, la siguiente descripción se tradujo del inglés original usando Google Translate para ayudar a los usuarios potenciales a decidir si se adapta a sus necesidades y puede contener errores gramaticales o lingüísticos. La descripción original en inglés también se proporciona a continuación.)
En este módulo, los estudiantes exploran y experimentan la utilidad de analizar los desafíos de álgebra y geometría a través del marco de las coordenadas. El módulo se abre con un desafío de modelado, uno que vuelve a ocurrir en las lecciones, para usar la geometría de coordenadas para programar el movimiento de un robot que está vinculado dentro de una cierta región poligonal del avión en el que se encuentra. Para establecer el escenario para un trabajo complejo en geometría analítica (coordenadas de cálculo de puntos de intersección de líneas y segmentos de línea o las coordenadas de puntos que dividen segmentos dados en relaciones de longitud específicas, etc.), los estudiantes describirán la región a través de sistemas de algebraico desigualdades y trabajo para restringir el movimiento del robot a lo largo de los segmentos de línea dentro de la región.
Encuentre el resto de los recursos matemáticos de Engageny en https://archive.org/details/engageny-mathematics.
English Description: In this module, students explore and experience the utility of analyzing algebra and geometry challenges through the framework of coordinates. The module opens with a modeling challenge, one that reoccurs throughout the lessons, to use coordinate geometry to program the motion of a robot that is bound within a certain polygonal region of the planethe room in which it sits. To set the stage for complex work in analytic geometry (computing coordinates of points of intersection of lines and line segments or the coordinates of points that divide given segments in specific length ratios, and so on), students will describe the region via systems of algebraic inequalities and work to constrain the robot motion along line segments within the region.
Find the rest of the EngageNY Mathematics resources at https://archive.org/details/engageny-mathematics.
Normally we find things using landmark navigation. When you move to a …
Normally we find things using landmark navigation. When you move to a new place, it may take you awhile to explore the new streets and buildings, but eventually you recognize enough landmarks and remember where they are in relation to each other. However, another accurate method for locating places and things is using grids and coordinates. In this activity, students will come up with their own system of a grid and coordinates for their classroom and understand why it is important to have one common method of map-making.
Prior to 1990, the performance of a student in precalculus at the …
Prior to 1990, the performance of a student in precalculus at the University of Washington was not a predictor of success in calculus. For this reason, the mathematics department set out to create a new course with a specific set of goals in mind:
A review of the essential mathematics needed to succeed in calculus. An emphasis on problem solving, the idea being to gain both experience and confidence in working with a particular set of mathematical tools. This text was created to achieve these goals and the 2004-05 academic year marks the eleventh year in which it has been used. Several thousand students have successfully passed through the course.
This book is full of worked out examples. We use the the notation “Soluion.” to indicate where the reasoning for a problem begins; the symbol ?? is used to indicate the end of the solution to a problem. There is a Table of Contents that is useful in helping you find a topic treated earlier in the course. It is also a good rough outline when it comes time to study for the final examination. The book also includes an index at the end. Finally, there is an appendix at the end of the text with ”answers” to most of the problems in the text. It should be emphasized these are ”answers” as opposed to ”solutions”. Any homework problems you may be asked to turn in will require you include all your work; in other words, a detailed solution. Simply writing down the answer from the back of the text would never be sufficient; the answers are intended to be a guide to help insure you are on the right track.
Projections and coordinates are key advancements in the geographic sciences that allow …
Projections and coordinates are key advancements in the geographic sciences that allow us to better understand the nature of the Earth and how to describe location. These innovations in describing the Earth are the basis for everything that is done in a GIS framework. Shape of the Earth is a critical starting point because in fact the Earth is not round but rather a more complex shape called a geoid. Coordinate systems are often referenced to a particular model shape of the Earth, but many different formats exist because not all coordinates work equally well in all areas. While projections and coordinates are abstract concepts in themselves, students eventually find them interesting because 1) it causes them to challenge their current ideas of the Earth's shape and 2) it is much easier to visualize these ideas for learning through interactive GIS such as Google Earth.
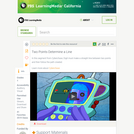
Students follow the instructor’s tutorial to make animal sprites move across the …
Students follow the instructor’s tutorial to make animal sprites move across the screen in wild patterns. This requires using Scratch’s coordinates system to control the x and y coordinates of the sprites. Students encounter the coordinate plane background, and try out their knowledge by identifying areas of the screen using only coordinate numbers. Sprite movement using coordinates will be central to the final coding project at the end of the unit.
An interactive applet and associated web page that demonstrate the slope (m) …
An interactive applet and associated web page that demonstrate the slope (m) of a line. The applet has two points that define a line. As the user drags either point it continuously recalculates the slope. The rise and run are drawn to show the two elements used in the calculation. The grid, axis pointers and coordinates can be turned on and off. The slope calculation can be turned off to permit class exercises and then turned back on the verify the answers. The applet can be printed as it appears on the screen to make handouts. The web page has a full description of the concept of slope, a worked example and has links to other pages relating to coordinate geometry. Applet can be enlarged to full screen size for use with a classroom projector. This resource is a component of the Math Open Reference Interactive Geometry textbook project at http://www.mathopenref.com.
Prepared with pre-algebra or algebra 1 classes in mind, this module leads …
Prepared with pre-algebra or algebra 1 classes in mind, this module leads students through the process of graphing data and finding a line of best fit while exploring the characteristics of linear equations in algebraic and graphic formats. Then, these topics are connected to real-world experiences in which people use linear functions. During the module, students use these scientific concepts to solve the following hypothetical challenge: You are a new researcher in a lab, and your boss has just given you your first task to analyze a set of data. It being your first assignment, you ask an undergraduate student working in your lab to help you figure it out. She responds that you must determine what the data represents and then find an equation that models the data. You believe that you will be able to determine what the data represents on your own, but you ask for further help modeling the data. In response, she says she is not completely sure how to do it, but gives a list of equations that may fit the data. This module is built around the legacy cycle, a format that incorporates educational research feindings on how people best learn.
No restrictions on your remixing, redistributing, or making derivative works. Give credit to the author, as required.
Your remixing, redistributing, or making derivatives works comes with some restrictions, including how it is shared.
Your redistributing comes with some restrictions. Do not remix or make derivative works.
Most restrictive license type. Prohibits most uses, sharing, and any changes.
Copyrighted materials, available under Fair Use and the TEACH Act for US-based educators, or other custom arrangements. Go to the resource provider to see their individual restrictions.