Students will use the Census Business Builder: Small Business Edition data access …
Students will use the Census Business Builder: Small Business Edition data access tool to gather and analyze information that entrepreneurs may consider when opening a business. This introductory activity assumes that students have limited experience using data access tools.
Students will explore maps containing census data from 1950 through 2000. They …
Students will explore maps containing census data from 1950 through 2000. They will analyze how education levels and median household incomes have changed over time and determine how the two might be correlated. Students will also come up with ideas for policies that could help address issues related to income and education.
Students will examine a table of 1850 Census data on employment to …
Students will examine a table of 1850 Census data on employment to understand the professions of free men across the United States at the time, calculating the percentages working in different industries. Students will also compare and contrast economies in the North and South during the Antebellum Period.
Students will use images, U.S. Census Bureau data, and interactive maps to …
Students will use images, U.S. Census Bureau data, and interactive maps to visualize and calculate arithmetic (population), agricultural, and physiological densities at local, regional, and national scales. They will also transfer their calculations to bar graphs.
Teachers will engage students in a discussion about what the Census Bureau …
Teachers will engage students in a discussion about what the Census Bureau does and what types of information it collects. Then students will read and annotate informational texts from the Census Bureau and work with a partner to answer questions about the texts. Students will also analyze an infographic of people with different professions to determine how each of those people might use the data gathered by the Census Bureau; students will be asked to use evidence from the infographic text to support their answers. Students will then complete a wireframe (similar to a graphic organizer) for an online resource about how census data can help their own community.
Students will analyze a variety of county-level census data, including on employment, …
Students will analyze a variety of county-level census data, including on employment, technology, and transportation, in histograms to compare and contrast the shapes of their distributions and to interpret measures of center and spread in context.
Students will learn about their state as they collect and organize business …
Students will learn about their state as they collect and organize business information using State Facts for Students, a U.S. Census Bureau data tool. Students have the opportunity to examine data about kids their age, as well as a variety of other facts selected to appeal to young students. Students will create a bar graph to represent how the numbers of selected business types have changed between 2010 and 2016.
This graduate seminar is taught in a lecture and lab exercise format. …
This graduate seminar is taught in a lecture and lab exercise format. The subject matter is tailored to introduce Environmental Engineering students to the use and potential of Geographic Information Systems in their discipline. Lectures will cover the general concepts of GIS use and introduce the material in the exercises that demonstrate the practical application of GIS.
Students will analyze and compare census data on the education levels of …
Students will analyze and compare census data on the education levels of African-Americans in 1850 and in 1880. Students will also discuss how historical events can affect data.
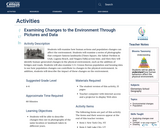
Students will examine how human actions and population changes can affect the …
Students will examine how human actions and population changes can affect the environment. Students will examine a series of photographs that compare famous landmarks (Times Square, the Saltair Pavilion in Utah, Laguna Beach, and Niagara Falls) across time, and then they will identify human-generated changes in the physical environment, such as the addition of bridges and roads. Students will also examine U.S. Census Bureau population and housing data to see how population changes can contribute to changes in the physical environment. In addition, students will describe the impact of these changes on the environment.
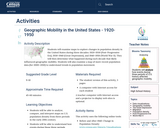
Students will examine maps to explore changes in population density in the …
Students will examine maps to explore changes in population density in the United States during three decades: 1920–1930 (Post-Progressive Era), 1930–1940 (Great Depression), and 1940–1950 (World War II). They will then determine what happened during each decade that likely influenced geographic mobility. Students will also examine a map of more recent population data (for 2000–2010) to understand trends in population movement.
The topic of Gerrymandering can be a difficult one to teach and …
The topic of Gerrymandering can be a difficult one to teach and get students to understand. This lesson includes several options, along with additional resources and information for the new teacher or a teacher who like many Americans may have trouble grasping and explaining gerrymandering and congressional redistricting. The lesson options include having students engage in a Debate and/or activity where they draw or redraw the boundaries of a state or congressional district.
Lesson seeds are ideas for the standards that can be used to …
Lesson seeds are ideas for the standards that can be used to build a lesson. Lesson seeds are not meant to be all-inclusive, nor are they substitutes for instruction. This lesson seed provides a compelling question and a bank of sources to use to drive an inquiry based lesson or a potential Evidence Based Argument Set (EBAS). When developing lessons from these seeds, teachers must consider the needs of all learners. Once you have built your lesson from the lesson seed, teachers are encouraged to post the lesson that has emerged from this lesson seed and share with others. Compelling Question: Is gerrymandering inconsistent with our representative democracy?EL Modifications: identify key vocabulary and add images to improve comprehension; consider adapting content, process and/or product based on Can Do WIDA Descriptors Image source: "Election" by OpenClipart-Vectors on Pixabay.com
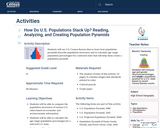
Students will use U.S. Census Bureau data to learn how population pyramids …
Students will use U.S. Census Bureau data to learn how population pyramids describe population structures and to calculate age range population percentages for a selected state that will help them create a population pyramid.
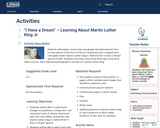
Students will analyze census data and graphs that demonstrate how certain aspects …
Students will analyze census data and graphs that demonstrate how certain aspects of the lives of African-Americans have changed since civil rights leader Martin Luther King Jr. delivered his “I Have a Dream” speech in 1963. Students will select a fact from these data, facts from other sources, and a historical photograph to include on a poster about King.
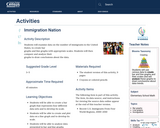
Students will examine data on the number of immigrants in the United …
Students will examine data on the number of immigrants in the United States, to create bar graphs and line graphs with appropriate scales. Students will then compare and analyze their graphs to draw conclusions about the data.
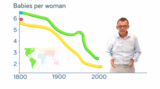
No matter what your area of interest is, you need to know …
No matter what your area of interest is, you need to know how to evaluate your subject, how to measure it. Global health is measured using something we call health indicators. To understand how a population in a country, or in a region, or even a part of a city is doing, you need to know its health indicators. How long do people live in this country? How many children die before they reach their fifth birthday in this city? What is the weight of children and adults in the northern part of the country? How many women die in childbirth in the country? Once you have looked at these numbers and compared them with other populations, you can make sense of the health situation of a population. In this lecture you will some basic health indicators, and also how the data is collected. Get transcript for video here: https://www.oercommons.org/courseware/module/58789/overview
Downloadable transcripts for the videos from Karolinska Institutet, from the course "An Introduction …
Downloadable transcripts for the videos from Karolinska Institutet, from the course "An Introduction to Global Health".The course is originally published at EdX.
Students will use tables and visualizations of data about geographic mobility to …
Students will use tables and visualizations of data about geographic mobility to explore rates and patterns of migration within, and immigration to, the United States. Using Census Bureau data tools, students will learn about past reasons for migration and immigration and understand the internal and external stresses of fluctuations in population.
No restrictions on your remixing, redistributing, or making derivative works. Give credit to the author, as required.
Your remixing, redistributing, or making derivatives works comes with some restrictions, including how it is shared.
Your redistributing comes with some restrictions. Do not remix or make derivative works.
Most restrictive license type. Prohibits most uses, sharing, and any changes.
Copyrighted materials, available under Fair Use and the TEACH Act for US-based educators, or other custom arrangements. Go to the resource provider to see their individual restrictions.