This resource was created by Marshall Payer in collaboration with Aaron Delhay …
This resource was created by Marshall Payer in collaboration with Aaron Delhay as part of the 2019-20 ESU-NDE Digital Age Pedagogy Project. Educators worked with coaches to create Unit Plans promoting BlendEd Learning Best Practices. This Unit Plan is designed for High School Mathematics.
This chart will help you identify which statistical analysis to used depending …
This chart will help you identify which statistical analysis to used depending on your research question.How to use: When deciding which statistics to use, first you must ask what is your research question looking for (difference or association). Then, identify what type of variable are you dealing with (Nominal, Ordinal, or Interval / Ratio), then the number of independent variables (IV) or dependent variables (DV) depending on the nature of your hypothesis. Below is a chart to help you identify which analysis to use for your hypothesis testing.
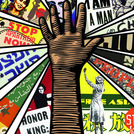
Created by NHPRC Teacher Participant/Creator Judith Jeremie for her AP World History …
Created by NHPRC Teacher Participant/Creator Judith Jeremie for her AP World History course; Adaptable to other grades. This assignment asks students to make meaningful connections between the past and their family/neighborhood history by conducting an interview of / researching a relative, gathering and organizing evidence of a historical moment / theme that has impacted that relative, and presenting their findings through art (graphic novel/ comic strips) or writing (narrative/poem).
Distributions and Variability Type of Unit: Project Prior Knowledge Students should be …
Distributions and Variability
Type of Unit: Project
Prior Knowledge
Students should be able to:
Represent and interpret data using a line plot. Understand other visual representations of data.
Lesson Flow
Students begin the unit by discussing what constitutes a statistical question. In order to answer statistical questions, data must be gathered in a consistent and accurate manner and then analyzed using appropriate tools.
Students learn different tools for analyzing data, including:
Measures of center: mean (average), median, mode Measures of spread: mean absolute deviation, lower and upper extremes, lower and upper quartile, interquartile range Visual representations: line plot, box plot, histogram
These tools are compared and contrasted to better understand the benefits and limitations of each. Analyzing different data sets using these tools will develop an understanding for which ones are the most appropriate to interpret the given data.
To demonstrate their understanding of the concepts, students will work on a project for the duration of the unit. The project will involve identifying an appropriate statistical question, collecting data, analyzing data, and presenting the results. It will serve as the final assessment.
Students write statistical questions that can be used to find information about …
Students write statistical questions that can be used to find information about a typical sixth grade student. Then, the class works together to informally plan how to find the typical arm span of a student in their class.Key ConceptsStatistical thinking, in large part, must deal with variability; statistical problem solving and decision making depend on understanding, explaining, and quantifying the variability in the data.“How tall is a sixth grader?” is a statistical question because all sixth graders are not the same height—there is variability.Goals and Learning ObjectivesUnderstand what a statistical question is.Realize there is variability in data and understand why.Describe informally the range, median, and mode of a set of data.
Four full-year digital course, built from the ground up and fully-aligned to …
Four full-year digital course, built from the ground up and fully-aligned to the Common Core State Standards, for 7th grade Mathematics. Created using research-based approaches to teaching and learning, the Open Access Common Core Course for Mathematics is designed with student-centered learning in mind, including activities for students to develop valuable 21st century skills and academic mindset.
This template is meant to be a guide for Nebraska Physical Education …
This template is meant to be a guide for Nebraska Physical Education Teachers when creating digital online lessons. Headings and/or topics not included in the lesson plan should be marked N/A.
This module was created in response to an observed need by BranchED …
This module was created in response to an observed need by BranchED and the module authors for efforts to increase the recognition, adaptation, and use of open educational resources (OER) among pre- and in-service teachers and the faculty who work in educator preparation programs. The module's purpose is to position teacher educators, teacher candidates and in-service teachers as empowered content creators. By explicitly teaching educators about content that has been licensed for re-use and informing them about their range of options for making their own works available to others, they will gain agency and can make inclusive and equity-minded decisions about curriculum content. The module provides instructional materials, resources, and activities about copyright, fair use, public domain, OER, and visual literacy to provide users with a framework for selecting, modifying, and developing curriculum materials.
Developed in 2009, this framework was designed for Washington educators to evaluate …
Developed in 2009, this framework was designed for Washington educators to evaluate instructional content for bias using five dimensions: Gender/Sex, Multicultural, Persons with Disabilities, Socio-Economic Status, and Family.Visit the updated 2020 version: Screening for Biased Content in Instructional Materials | OSPI
Created by NHPRC Teacher Participant/Creator Deirdre H. Tuite for US History; Adaptable …
Created by NHPRC Teacher Participant/Creator Deirdre H. Tuite for US History; Adaptable to other grades. Throughout this year we study how the United States came to fruition. We evaluate the reasons behind the establishment of the United States and the key figures in our history. However, it is important to remember that students too are part of America’s history. The student's history is our nation’s history. As we progress through the year, these assignments have students documenting their own history, through various projects: an interview, a community snapshot, and family artifact, ending with a personal essay.
This is a remixed version of World History: Culture, States, and Societies …
This is a remixed version of World History: Culture, States, and Societies to 1500 by Berger, et al. It's a textbook suitable for the World History survey. I have reorganized the text in order to provide a more globally integrated narrative. Each chapter invites students to compare and contrast developments across regions during a period of time.
This version of the book retains the text of the original but with updated references to chapters. I verified and, if necessary, updated links to online resources. In cases where the exact illustration used in the original version was not available, I have substituted equivalent ones. I also created and edited segues and other “connective tissue” as well to (hopefully) ensure that this version of the book reads as smoothly as the original.
Additional changes include:
More concise lists of “key terms” in each chapter Expanded coverage of the Persian Empire Expanded coverage of the end of the Yuan Dynasty Added brief overview of the early Ming Dynasty including the voyages of Zheng He Work on this adaption was generously sponsored by a grant from Michigan Colleges Online, a project of the Michigan Community College Association.
No restrictions on your remixing, redistributing, or making derivative works. Give credit to the author, as required.
Your remixing, redistributing, or making derivatives works comes with some restrictions, including how it is shared.
Your redistributing comes with some restrictions. Do not remix or make derivative works.
Most restrictive license type. Prohibits most uses, sharing, and any changes.
Copyrighted materials, available under Fair Use and the TEACH Act for US-based educators, or other custom arrangements. Go to the resource provider to see their individual restrictions.