In this problem-based learning module, students will ‘dig’ for fossils in a digital …
In this problem-based learning module, students will ‘dig’ for fossils in a digital environment, using the advanced graphing techniques of line-of-best-fit and piecewise functions to look for different kinds of trends in the health of the history of the earth. They will apply this information to their knowledge of the laws of superposition and index fossils to form a complete analysis in the historical health as well as to predict where we are going in the future.
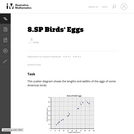
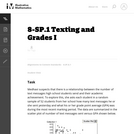
This task asks students to glean contextual information about bird eggs from …
This task asks students to glean contextual information about bird eggs from a collection of measurements of said eggs organized in a scatter plot. In particular, students are asked to identify a correlation and use it to make interpolative predictions, and reason about the properties of specific eggs via the graphical presentation of the data.
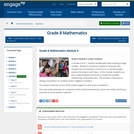
In Grades 6 and 7, students worked with data involving a single …
In Grades 6 and 7, students worked with data involving a single variable. Module 6 introduces students to bivariate data. Students are introduced to a function as a rule that assigns exactly one value to each input. In this module, students use their understanding of functions to model the possible relationships of bivariate data. This module is important in setting a foundation for students work in algebra in Grade 9.
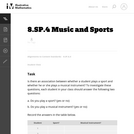
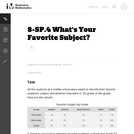
In this group task students collect data and analyze from the class …
In this group task students collect data and analyze from the class to answer the question "is there an association between whether a student plays a sport and whether he or she plays a musical instrument? "
(Nota: Esta es una traducción de un recurso educativo abierto creado por …
(Nota: Esta es una traducción de un recurso educativo abierto creado por el Departamento de Educación del Estado de Nueva York (NYSED) como parte del proyecto "EngageNY" en 2013. Aunque el recurso real fue traducido por personas, la siguiente descripción se tradujo del inglés original usando Google Translate para ayudar a los usuarios potenciales a decidir si se adapta a sus necesidades y puede contener errores gramaticales o lingüísticos. La descripción original en inglés también se proporciona a continuación.)
En los grados 6 y 7, los estudiantes trabajaron con datos que involucraban una sola variable. El módulo 6 presenta a los estudiantes a bivariando datos. Los estudiantes se introducen a una función como una regla que asigna exactamente un valor a cada entrada. En este módulo, los estudiantes usan su comprensión de las funciones para modelar las posibles relaciones de datos bivariados. Este módulo es importante para establecer una base para los estudiantes que trabajan en álgebra en el grado 9.
English Description: In Grades 6 and 7, students worked with data involving a single variable. Module 6 introduces students to bivariate data. Students are introduced to a function as a rule that assigns exactly one value to each input. In this module, students use their understanding of functions to model the possible relationships of bivariate data. This module is important in setting a foundation for students work in algebra in Grade 9.
A variable is any characteristics, number, or quantity that can be measured …
A variable is any characteristics, number, or quantity that can be measured or counted. A variable may also be called a data item. Age, sex, business income and expenses, country of birth, capital expenditure, class grades, eye colour and vehicle type are examples of variables. It is called a variable because the value may vary between data units in a population, and may change in value over time. There are different ways variables can be described according to the ways they can be studied, measured, and presented.
No restrictions on your remixing, redistributing, or making derivative works. Give credit to the author, as required.
Your remixing, redistributing, or making derivatives works comes with some restrictions, including how it is shared.
Your redistributing comes with some restrictions. Do not remix or make derivative works.
Most restrictive license type. Prohibits most uses, sharing, and any changes.
Copyrighted materials, available under Fair Use and the TEACH Act for US-based educators, or other custom arrangements. Go to the resource provider to see their individual restrictions.