In this activity, kids will work on two fundamental early math skills …
In this activity, kids will work on two fundamental early math skills – sorting/classifying, and graphing. There will also be some great fine motor skill practice! Includes place-based discussion questions, activity instructions, extension activities, songs, and student graph worksheets.
NGSS: K-LS1-1, 1-LS1-1, partially meets K-ESS3-1 (book and discussion)
Common Core: MP.4
Time: 45 minutes
Matierals: bag of dried beans ("16 bean soup"), paper bowls, glue, chart paper, the book "One Bean" or similar book about growing food plants, especially beans.
Students visit second- and fourth-grade classes to measure the heights of older …
Students visit second- and fourth-grade classes to measure the heights of older students using large building blocks as a non-standard unit of measure. They also measure adults in the school community. Results are displayed in age-appropriate bar graphs (paper cut-outs of miniature building blocks glued on paper to form bar graphs) enabling a comparison of the heights of different age groups. The activities that comprise this activity help students develop the concepts and vocabulary to describe, in a non-ambiguous way, how heights change as children age. This introduction to graphing provides an important foundation for creating and interpreting graphs in future years.
Students plant sunflower seeds in plastic cups, and once germinated, expose them …
Students plant sunflower seeds in plastic cups, and once germinated, expose them to varying light or soil moisture conditions. They measure growth of the seedlings every few days using non-standard measurement (inch cubes). After a few weeks, they compare the growth of plants exposed to the different conditions and make bar comparative graphs, which they analyze to draw conclusions about the needs of plants.
STUDENT ACTIVITY - 4th - NCThis is a distance-learning lesson students can …
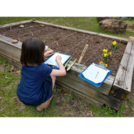
STUDENT ACTIVITY - 4th - NCThis is a distance-learning lesson students can complete at home. The student will explore and record data about different plants that they observe. Then they will create a bar graph to reflect the data that that they collected. This activity was created by Out Teach (out-teach.org), a nonprofit providing outdoor experiential learning to transform Science education for students in under-served communities.
In this lesson, students will explore and record data about different plants …
In this lesson, students will explore and record data about different plants that they observe. Students will then create a bar graph to reflect the data that that they collected. For example, a student might find 7 tomato plants, 5 cabbages, and 4 squash plants; their graph would reflect these numbers.
In this video from Cyberchase, the CyberSquad helps Ms. Fileshare realize that …
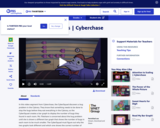
In this video from Cyberchase, the CyberSquad helps Ms. Fileshare realize that Hacker has been deceiving her as they take a look at the scale of a bar graph.
Principles of Macroeconomics 2e covers the scope and sequence of most introductory …
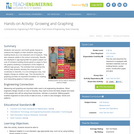
Principles of Macroeconomics 2e covers the scope and sequence of most introductory economics courses. The text includes many current examples, which are handled in a politically equitable way. The outcome is a balanced approach to the theory and application of economics concepts. The second edition has been thoroughly revised to increase clarity, update data and current event impacts, and incorporate the feedback from many reviewers and adopters.Changes made in Principles of Macroeconomics 2e are described in the preface and the transition guide to help instructors transition to the second edition.
Students apply pre-requisite statistics knowledge and concepts learned in an associated lesson …
Students apply pre-requisite statistics knowledge and concepts learned in an associated lesson to a real-world state-of-the-art research problem that asks them to quantitatively analyze the effectiveness of different cracked steel repair methods. As if they are civil engineers, students statistically analyze and compare 12 sets of experimental data from seven research centers around the world using measurements of central tendency, five-number summaries, box-and-whisker plots and bar graphs. The data consists of the results from carbon-fiber-reinforced polymer patched and unpatched cracked steel specimens tested under the same stress conditions. Based on their findings, students determine the most effective cracked steel repair method, create a report, and present their results, conclusions and recommended methods to the class as if they were presenting to the mayor and city council. This activity and its associated lesson are suitable for use during the last six weeks of the AP Statistics course; see the topics and timing note for details.
This article provides ideas, lessons and resources on how elementary teachers can …
This article provides ideas, lessons and resources on how elementary teachers can integrate map skills, math, and art into lessons about the geography of the Arctic and Antarctica.
Students conduct an experiment to determine whether or not the sense of …
Students conduct an experiment to determine whether or not the sense of smell is important to being able to recognize foods by taste. They do this by attempting to identify several different foods that have similar textures. For some of the attempts, students hold their noses and close their eyes, while for others they only close their eyes. After they have conducted the experiment, they create bar graphs showing the number of correct and incorrect identifications for the two different experimental conditions tested.
This is a fun hands on Valentine activity to use with K-1 …
This is a fun hands on Valentine activity to use with K-1 age students to help them understand bar graphs and how these typ of graphs represent real numbers.
No restrictions on your remixing, redistributing, or making derivative works. Give credit to the author, as required.
Your remixing, redistributing, or making derivatives works comes with some restrictions, including how it is shared.
Your redistributing comes with some restrictions. Do not remix or make derivative works.
Most restrictive license type. Prohibits most uses, sharing, and any changes.
Copyrighted materials, available under Fair Use and the TEACH Act for US-based educators, or other custom arrangements. Go to the resource provider to see their individual restrictions.