Updating search results...

Search Resources

46 Results

View
Selected filters:
  • atmospheric-and-oceanic-circulation
Aquarius: Ocean Circulation
Read the Fine Print
Rating
0.0 stars

This short video from NASA discusses the role that salinity plays in Earth's climate and ocean circulation, focusing on the observations of the Aquarius satellite.

Subject:
Applied Science
Atmospheric Science
Career and Technical Education
Environmental Science
Environmental Studies
Oceanography
Physical Science
Provider:
CLEAN: Climate Literacy and Energy Awareness Network
Provider Set:
CLEAN: Climate Literacy and Energy Awareness Network
Author:
NASA
Date Added:
08/17/2018
Changing Planet: Fresh Water in the Arctic
Read the Fine Print
Rating
0.0 stars

This Changing Planet video documents scientists' concerns regarding how melting Arctic sea ice will increase the amount of fresh water in the Beaufort Gyre, which could spill out into the Atlantic and cause major climate shifts in North America and Western Europe. The video includes interviews with scientists and a look at the basics of how scientists measure salinity in the ocean and how ocean circulation works in the Arctic.

Subject:
Atmospheric Science
Career and Technical Education
Environmental Studies
Geoscience
History
History, Law, Politics
Oceanography
Physical Science
Provider:
CLEAN: Climate Literacy and Energy Awareness Network
Provider Set:
CLEAN: Climate Literacy and Energy Awareness Network
Author:
NBC Learn
NESTA - Windows to the Universe
Date Added:
10/27/2014
Climate Change and Atlantic Hurricanes: A GIS Inquiry
Conditional Remix & Share Permitted
CC BY-NC-SA
Rating
0.0 stars

Students are asked to make a general hypothesis about whether Atlantic hurricane have been changing over time in response to recent climate change. It is expected that at an introductory level with only the most basic background instruction, students will focus on numbers, locations, or intensities of hurricanes. Example hypotheses might be

The numbers of hurricanes are increasing (or decreasing)
Hurricanes are becoming more intense
Hurricanes are forming in new locations
Hurricane season is lengthening

They are then asked to develop more pointed questions that they can test. Some example questions for each hypothesis are given below:

Hypothesis 1 might lead to questions like "More hurricanes (or tropical storms) are forming each year" or "More hurricanes are striking land each year."
Hypothesis 2 might lead to questions such as "The maximum wind speed for hurricanes is increasing" or "The minimum barometric pressure is decreasing."
Hypothesis 3 might lead to questions like "Hurricanes are forming further north."
Hypothesis 4 might lead to questions such as "Hurricanes are forming earlier and later."

To answer these questions would require students to understand some background about hurricanes, like how many typically occur in the past (which leads to questions about data collection and observing hurricanes), how hurricane intensity is measured, or at what latitudes hurricanes typically form.

Then they are given a table or map data (derived from NOAA GIS data of hurricane tracks and intensity) to test their hypotheses.

The results of their inquiries and data collection will be shared with the class as parts of small groups initially, and will culminate as a small group presentation.

(Note: this resource was added to OER Commons as part of a batch upload of over 2,200 records. If you notice an issue with the quality of the metadata, please let us know by using the 'report' button and we will flag it for consideration.)
Subject:
Applied Science
Biology
Environmental Science
Life Science
Mathematics
Measurement and Data
Oceanography
Physical Science
Material Type:
Activity/Lab
Provider:
Science Education Resource Center (SERC) at Carleton College
Provider Set:
Teach the Earth
Author:
Chris Van de Ven
Date Added:
08/24/2019
Climate Change and the Oceans
Read the Fine Print
Rating
0.0 stars

This activity covers the role that the oceans may play in climate change and how climate change may affect the oceans. It is lesson 8 in a nine-lesson module Visualizing and Understanding the Science of Climate Change.

Subject:
Atmospheric Science
Physical Science
Material Type:
Activity/Lab
Provider:
CLEAN: Climate Literacy and Energy Awareness Network
Provider Set:
CLEAN: Climate Literacy and Energy Awareness Network
Author:
The King's Centre for Visualization in Science
Date Added:
09/24/2018
Climate Variability in the North Atlantic
Read the Fine Print
Rating
0.0 stars

In this activity, students examine climate variability in the North Atlantic associated with the North Atlantic Oscillation (NOA) in a case study format.

Subject:
Applied Science
Atmospheric Science
Career and Technical Education
Environmental Science
Environmental Studies
Oceanography
Physical Science
Material Type:
Activity/Lab
Provider:
CLEAN: Climate Literacy and Energy Awareness Network
Provider Set:
CLEAN: Climate Literacy and Energy Awareness Network
Author:
Cindy Shellito
InTeGrate, SERC
University of Northern Colorado
Date Added:
09/24/2018
Confirmation of the IPCC Prediction re: Increased Storminess
Conditional Remix & Share Permitted
CC BY-NC-SA
Rating
0.0 stars

This activity represents a culmination project for this unit by means of which students can assess whether the IPCC prediction of increased storminess as an outcome of global warming survives testing. For the previous three weeks students will have conducted several inquiry-based group activities designed to introduce and reinforce fundamental meteorology/climatology concepts. In this 2-day project, students access online AVHRR SST imagery, as well as tabulated numeric data regarding historical North American tropical cyclones, import data into Excel for interpretation and analysis, and submit two group reports.

(Note: this resource was added to OER Commons as part of a batch upload of over 2,200 records. If you notice an issue with the quality of the metadata, please let us know by using the 'report' button and we will flag it for consideration.)

Subject:
Applied Science
Biology
Environmental Science
Life Science
Mathematics
Measurement and Data
Oceanography
Physical Science
Statistics and Probability
Material Type:
Activity/Lab
Provider:
Science Education Resource Center (SERC) at Carleton College
Provider Set:
Teach the Earth
Author:
Robert Kuhlman
Date Added:
08/21/2020
Deep water circulation and chemistry jigsaw
Conditional Remix & Share Permitted
CC BY-NC-SA
Rating
0.0 stars

This activity is designed to introduce students to the way in which thermohaline circulation and the biological pump influence the distribution of nutrients, oxygen, carbon, and radiocarbon in the Atlantic vs. Pacific Oceans.

(Note: this resource was added to OER Commons as part of a batch upload of over 2,200 records. If you notice an issue with the quality of the metadata, please let us know by using the 'report' button and we will flag it for consideration.)
Subject:
Applied Science
Biology
Chemistry
Environmental Science
Life Science
Oceanography
Physical Science
Material Type:
Activity/Lab
Provider:
Science Education Resource Center (SERC) at Carleton College
Provider Set:
Teach the Earth
Author:
Michele LaVigne
Date Added:
08/29/2019
Earth's Climate System
Conditional Remix & Share Permitted
CC BY-NC-SA
Rating
0.0 stars

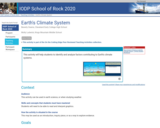
This activity will help students to identify and analyze factors contributing to Earth's climate systems.


Provenance: Beverly Owens, Cleveland Early College High School
Reuse: This item is offered under a Creative Commons Attribution-NonCommercial-ShareAlike license http://creativecommons.org/licenses/by-nc-sa/3.0/ You may reuse this item for non-commercial purposes as long as you provide attribution and offer any derivative works under a similar license.

(Note: this resource was added to OER Commons as part of a batch upload of over 2,200 records. If you notice an issue with the quality of the metadata, please let us know by using the 'report' button and we will flag it for consideration.)
Subject:
Applied Science
Biology
Environmental Science
Life Science
Oceanography
Physical Science
Material Type:
Activity/Lab
Provider:
Science Education Resource Center (SERC) at Carleton College
Provider Set:
Teach the Earth
Author:
Beverly Owens
Molly Ludwick
Date Added:
09/26/2022
Exploring the Link Between Hurricanes and Climate Using GCM Results
Unrestricted Use
CC BY
Rating
0.0 stars

In this activity, students examine global climate model output and consider the potential impact of global warming on tropical cyclone initiation and evolution. As a follow-up, students read two short articles on the connection between hurricanes and global warming and discuss these articles in context of what they have learned from model output.

Subject:
Applied Science
Atmospheric Science
Career and Technical Education
Environmental Science
Environmental Studies
Oceanography
Physical Science
Material Type:
Activity/Lab
Provider:
CLEAN: Climate Literacy and Energy Awareness Network
Provider Set:
CLEAN: Climate Literacy and Energy Awareness Network
Author:
Cindy Shellito
SERC - On the Cutting Edge Collection
Date Added:
06/19/2012
Flow: Currents and Climate
Read the Fine Print
Educational Use
Rating
0.0 stars

This video introduces viewers to oceanic thermohaline circulation - the system of global ocean currents that cycle warm and cold water across the planet.

Subject:
Applied Science
Atmospheric Science
Career and Technical Education
Environmental Science
Environmental Studies
Oceanography
Physical Science
Material Type:
Diagram/Illustration
Reading
Provider:
CLEAN: Climate Literacy and Energy Awareness Network
Provider Set:
CLEAN: Climate Literacy and Energy Awareness Network
Author:
National Oceanic and Atmospheric Administration
Science On a Sphere
Date Added:
07/28/2022
Fluid Earth Viewer
Read the Fine Print
Educational Use
Rating
0.0 stars

This interactive online visualization allows the user to view a variety of weather patterns including temperature, wind, and wave action over time.

Subject:
Applied Science
Atmospheric Science
Career and Technical Education
Environmental Science
Environmental Studies
Oceanography
Physical Science
Material Type:
Reading
Simulation
Provider:
CLEAN: Climate Literacy and Energy Awareness Network
Provider Set:
CLEAN: Climate Literacy and Energy Awareness Network
Author:
Byrd Polar and Climate Research Center
Ohio State University
Date Added:
07/27/2022
Giving Rise to the Jet Stream
Read the Fine Print
Rating
0.0 stars

This 15-panel interactive from NOVA Online describes some of the factors (such as Earth's rotation and the sun's uneven heating of Earth's surface) contributing to the formation of the high-speed eastward flows of the jet streams, found near the top of the troposphere. These jet streams play a major role in guiding weather systems.

Subject:
Physical Science
Provider:
CLEAN: Climate Literacy and Energy Awareness Network
Provider Set:
CLEAN: Climate Literacy and Energy Awareness Network
Author:
Teachers' Domain
WGBH NOVA
Date Added:
09/24/2018
Global Atmospheric Circulation and the Indian Monsoon
Conditional Remix & Share Permitted
CC BY-NC-SA
Rating
0.0 stars

In this project students learn through lecture, video, and sketching about the Coriolis effect, the "Six-Cell Generalized Global Atmospheric Circulation Model", the shifting ITCZ, the Indian Monsoon, and its impact on the day-to-day lives of the people of India.
The outcomes for this assignment are aligned with course-specific outcomes articulated in the Minnesota Transfer Curriculum. They are:

Discuss/compare characteristics of diverse cultures and environments in the context of ocean science.
Explain the basic structure and function of the ocean realm, the impact of humans on it, and the impact of the ocean realm on humans.

(Note: this resource was added to OER Commons as part of a batch upload of over 2,200 records. If you notice an issue with the quality of the metadata, please let us know by using the 'report' button and we will flag it for consideration.)

Subject:
Applied Science
Atmospheric Science
Biology
Environmental Science
Life Science
Oceanography
Physical Science
Material Type:
Activity/Lab
Provider:
Science Education Resource Center (SERC) at Carleton College
Provider Set:
Teach the Earth
Author:
David Kobilka
Date Added:
12/11/2020
Gulf Stream Heat Budget and Europe
Conditional Remix & Share Permitted
CC BY-NC-SA
Rating
0.0 stars

Students are presented with a scenario (problem) to recommend whether the Gulf Stream is responsible for keeping Europe warm and the potential effects if polar ice were to continue melting. The students work in small groups and discuss the problem and identify the issue. They then list everything they know about the issue and develop a problem statement. They then ask what they need to know to solve the problem and search the Internet data sites, etc., and analyze the information gathered. They complete the activity by preparing an individual report and PowerPoint presentation where they make a recommendation or other appropriate resolution of the problem based on the data, visualizations, and background information.

(Note: this resource was added to OER Commons as part of a batch upload of over 2,200 records. If you notice an issue with the quality of the metadata, please let us know by using the 'report' button and we will flag it for consideration.)

Subject:
Applied Science
Biology
Environmental Science
Geoscience
History
History, Law, Politics
Life Science
Oceanography
Physical Science
Material Type:
Activity/Lab
Case Study
Homework/Assignment
Provider:
Science Education Resource Center (SERC) at Carleton College
Provider Set:
Teach the Earth
Author:
Warren Tomkiewicz
Date Added:
08/07/2019
Gulf Stream Heat Budget and Europe's Mild Climate: A Problem-based Learning Activity
Unrestricted Use
CC BY
Rating
0.0 stars

In this role-playing activity, learners are presented with a scenario in which they determine whether the Gulf Stream is responsible for keeping northern Europe warm. They must also address the potential future of the Gulf Stream if polar ice were to continue melting. The students work in small groups to identify the issue, discuss the problem, and develop a problem statement. They are then asked what they need to know to solve the problem.

Subject:
Applied Science
Atmospheric Science
Career and Technical Education
Environmental Science
Environmental Studies
Oceanography
Physical Science
Material Type:
Activity/Lab
Provider:
CLEAN: Climate Literacy and Energy Awareness Network
Provider Set:
CLEAN: Climate Literacy and Energy Awareness Network
Author:
From the On The Cutting Edge activity collection
Plymouth State University
Warren C. Tomkiewicz
Date Added:
06/19/2012
Hot, Cold, Fresh and Salty
Read the Fine Print
Rating
0.0 stars

The NOAA Ocean Service Education lab requires students create and manipulate solutions simulating different ocean water characteristics in order to recognize that the effects of salinity and temperature are the drivers of thermohaline circulation.

Subject:
Atmospheric Science
Career and Technical Education
Environmental Studies
Oceanography
Physical Science
Material Type:
Activity/Lab
Provider:
CLEAN: Climate Literacy and Energy Awareness Network
Provider Set:
CLEAN: Climate Literacy and Energy Awareness Network
Author:
Jerry Roth
NOAA Ocean Service
Date Added:
09/24/2018
Hurricanes as Heat Engines
Read the Fine Print
Rating
0.0 stars

In this activity, students examine the effects of hurricanes on sea surface temperature using NASA data. They examine authentic sea surface temperature data to explore how hurricanes extract heat energy from the ocean surface.

Subject:
Physical Science
Material Type:
Activity/Lab
Provider:
CLEAN: Climate Literacy and Energy Awareness Network
Provider Set:
CLEAN: Climate Literacy and Energy Awareness Network
Author:
My NASA Data
NASA
Date Added:
09/24/2018
Is There a Trend in Hurricane Number or Intensity?
Conditional Remix & Share Permitted
CC BY-NC-SA
Rating
0.0 stars

In essence, this is an opportunity for students to practice calculating trends with uncertainties to draw conclusions about whether or not there is a trend in hurricane intensity. It follows closely with the IPCC AR4 findings, and is guided so that students will know exactly what they have to do - step by step. Please see the attached document for the bulk of the activity. There are some additional instructor's notes that give a little more background on the concepts involved with confidence intervals and trends. There is also an excel file with all of the necessary data already tabulated for the exercise - so you don't need to go find it yourself unless you want to.

(Note: this resource was added to OER Commons as part of a batch upload of over 2,200 records. If you notice an issue with the quality of the metadata, please let us know by using the 'report' button and we will flag it for consideration.)
Subject:
Applied Science
Biology
Environmental Science
Life Science
Mathematics
Measurement and Data
Oceanography
Physical Science
Statistics and Probability
Material Type:
Activity/Lab
Provider:
Science Education Resource Center (SERC) at Carleton College
Provider Set:
Teach the Earth
Author:
Todd Ellis
Date Added:
11/24/2020
Lab 2: Earth's Frozen Oceans
Conditional Remix & Share Permitted
CC BY-NC-SA
Rating
0.0 stars

In Part A of this activity, students will learn about how sea ice forms and influences ocean currents around the globe. In Part B, they will look at how sea ice thickness changes over time. Finally, in Part C, students will use NSIDC sea ice index data to explore changes in sea ice extent on multiple time scales including months, years, and decades.

(Note: this resource was added to OER Commons as part of a batch upload of over 2,200 records. If you notice an issue with the quality of the metadata, please let us know by using the 'report' button and we will flag it for consideration.)
Subject:
Applied Science
Biology
Environmental Science
Geoscience
Life Science
Mathematics
Measurement and Data
Oceanography
Physical Science
Physics
Statistics and Probability
Material Type:
Activity/Lab
Provider:
Science Education Resource Center (SERC) at Carleton College
Provider Set:
Teach the Earth
Date Added:
06/27/2022
Lab 4: It's All Connected: Global Circulation
Conditional Remix & Share Permitted
CC BY-NC-SA
Rating
0.0 stars

In Part A:Students are introduced to the global circulation patterns of the atmosphere and the oceans, and investigate how those circulation patterns might influence their local region.
In Part B: Students study surface ocean currents and then predict the pathway of a floating object dropped into the ocean at a particular point, maybe one closest to their own region. Then, using a computer model of ocean currents, they test their predictions.

(Note: this resource was added to OER Commons as part of a batch upload of over 2,200 records. If you notice an issue with the quality of the metadata, please let us know by using the 'report' button and we will flag it for consideration.)
Subject:
Applied Science
Biology
Environmental Science
Geoscience
Life Science
Oceanography
Physical Science
Material Type:
Activity/Lab
Diagram/Illustration
Interactive
Provider:
Science Education Resource Center (SERC) at Carleton College
Provider Set:
Teach the Earth
Date Added:
04/15/2021