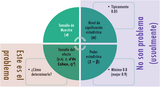
Esta guía práctica acompaña la serie de videos Poder estadístico y tamaño …
Esta guía práctica acompaña la serie de videos Poder estadístico y tamaño de muestra en R, de mi canal de YouTube Investigación Abierta, que recomiendo ver antes de leer este documento. Contiene una explicación general del análisis de poder estadístico y cálculo de tamaño de muestra, centrándose en el procedimiento para realizar análisis de poder y tamaños de muestra en jamovi y particularmente en R, usando los paquetes pwr (para diseños sencillos) y Superpower (para diseños factoriales más complejos). La sección dedicada a pwr está ampliamente basada en este video de Daniel S. Quintana (2019).
This project will recommend a big data analytics tool for the customers, …
This project will recommend a big data analytics tool for the customers, ministry and hotels in Oman to adapt new hotel services after considering together hotel services with customer opinions. The IOT services are for customer convenience, control in online booking IOT services such as radio station, smart coffee makers, dim lights and energy programmed lights.The big data analytics will analyze the hotel information , rating and reviews of UK , Dubai to recomend aspect like services especially IOT services. The coverage of Analysis in R: Big data Analytics with Hadoop/HDFS Sentiment AnalysisEmotion Analysis Machine Learning K-mean , Regression and Neural NetworkAnova version to analyze Big data of 90k reviews
This website is an interactive educational application developed to simulate and visualize …
This website is an interactive educational application developed to simulate and visualize various statistical concepts:
Law of Large Numbers Central Limit Theorem Confidence Intervals Hypothesis Testing ANOVA Joint Distributions Least Squares Sample Distribution of OLS Estimators The OLS Estimators are Consistent Omitted Variable Bias Multiple Regression
Project of Professor Tanya Byker and Professor Amanda Gregg at Middlebury College, with research assistants Kevin Serrao, Class of 2018, Dylan Mortimer, Class of 2019, Ammar Almahdy, Class of 2020, Jacqueline Palacios, Class of 2020, Siyuan Niu, Class of 2021, David Gikoshvili, Class of 2021, and Ethan Saxenian, Class of 2022.
These resources were created to compliment our undergraduate statistics lab manual, Applied …
These resources were created to compliment our undergraduate statistics lab manual, Applied Data Analysis in Psychology: Exploring Diversity with Statistics, published by Kendall Hunt publishing company. Like our lab manual, these JASP walk-through guides meaningfully and purposefully integrate and highlight diversity research to teach students how to analyze data in an open-source statistical program. The data sets utilized in these guides are from open-access databases (e.g., Pew Research Center, PLoS One, ICPSR, and more). Guides with step-by-step instructions, including annotated images and examples of how to report findings in APA format, are included for the following statistical tests: independent samples t test, paired samples t test, one-way ANOVA, two factor ANOVA, chi-square test, Pearson correlation, simple regression, and multiple regression.
This course covers descriptive statistics, the foundation of statistics, probability and random …
This course covers descriptive statistics, the foundation of statistics, probability and random distributions, and the relationships between various characteristics of data. Upon successful completion of the course, the student will be able to: Define the meaning of descriptive statistics and statistical inference; Distinguish between a population and a sample; Explain the purpose of measures of location, variability, and skewness; Calculate probabilities; Explain the difference between how probabilities are computed for discrete and continuous random variables; Recognize and understand discrete probability distribution functions, in general; Identify confidence intervals for means and proportions; Explain how the central limit theorem applies in inference; Calculate and interpret confidence intervals for one population average and one population proportion; Differentiate between Type I and Type II errors; Conduct and interpret hypothesis tests; Compute regression equations for data; Use regression equations to make predictions; Conduct and interpret ANOVA (Analysis of Variance). (Mathematics 121; See also: Biology 104, Computer Science 106, Economics 104, Psychology 201)
This course is an introduction to statistical data analysis. Topics are chosen …
This course is an introduction to statistical data analysis. Topics are chosen from applied probability, sampling, estimation, hypothesis testing, linear regression, analysis of variance, categorical data analysis, and nonparametric statistics.
This 13-minute video lesson provides analysis of variance 2: Calculating SSW and …
This 13-minute video lesson provides analysis of variance 2: Calculating SSW and SSB (total sum of squares within and between). [Statistics playlist: Lesson 76 of 85]
Provides students with the basic tools for analyzing experimental data, properly interpreting …
Provides students with the basic tools for analyzing experimental data, properly interpreting statistical reports in the literature, and reasoning under uncertain situations. Topics organized around three key theories: Probability, statistical, and the linear model. Probability theory covers axioms of probability, discrete and continuous probability models, law of large numbers, and the Central Limit Theorem. Statistical theory covers estimation, likelihood theory, Bayesian methods, bootstrap and other Monte Carlo methods, as well as hypothesis testing, confidence intervals, elementary design of experiments principles and goodness-of-fit. The linear model theory covers the simple regression model and the analysis of variance. Places equal emphasis on theory, data analyses, and simulation studies.
No restrictions on your remixing, redistributing, or making derivative works. Give credit to the author, as required.
Your remixing, redistributing, or making derivatives works comes with some restrictions, including how it is shared.
Your redistributing comes with some restrictions. Do not remix or make derivative works.
Most restrictive license type. Prohibits most uses, sharing, and any changes.
Copyrighted materials, available under Fair Use and the TEACH Act for US-based educators, or other custom arrangements. Go to the resource provider to see their individual restrictions.