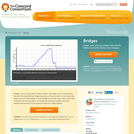
Bridges come in a wide variety of sizes, shapes, and lengths and …
Bridges come in a wide variety of sizes, shapes, and lengths and are found all over the world. It is important that bridges are strong so they are safe to cross. Design and build a your own model bridge. Test your bridge for strength using a force sensor that measures how hard you pull on your bridge. By observing a graph of the force, determine the amount of force needed to make your bridge collapse.
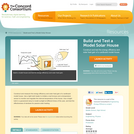
Construct and measure the energy efficiency and solar heat gain of a …
Construct and measure the energy efficiency and solar heat gain of a cardboard model house. Use a light bulb heater to imitate a real furnace and a temperature sensor to monitor and regulate the internal temperature of the house. Use a bright bulb in a gooseneck lamp to model sunlight at different times of the year, and test the effectiveness of windows for passive solar heating.
A bungee jump involves jumping from a tall structure while connected to …
A bungee jump involves jumping from a tall structure while connected to a large elastic cord. Design a bungee jump that is "safe" for a hard-boiled egg. Create a safety egg harness and connect it to a rubber band, which is your the "bungee cord." Finally, attach your bungee cord to a force sensor to measures the forces that push or pull your egg.
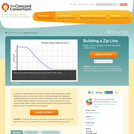
A zip line is a way to glide from one point to another while hanging from a cable. Design and create a zip line that is safe for a hard-boiled egg. After designing a safety egg harness, connect the harness to fishing line or wire connected between two chairs of different heights using a paper clip. Learn to improve your zip line based on data. Attach a motion sensor at the bottom of your zip line and display a graph to show how smooth a ride your egg had!
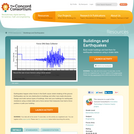
Earthquakes happen when forces in the Earth cause violent shaking of the …
Earthquakes happen when forces in the Earth cause violent shaking of the ground. Earthquakes can be very destructive to buildings and other man-made structures. Design and build various types of buildings, then test your buildings for earthquake resistance using a shake table and a force sensor that measures how hard a force pushes or pulls your building.
Explore a NetLogo model of populations of rabbits, grass, and weeds. First, …
Explore a NetLogo model of populations of rabbits, grass, and weeds. First, adjust the model to start with a different rabbit population size. Then adjust model variables, such as how fast the plants or weeds grow, to get more grass than weeds. Change the amount of energy the grass or weeds provide to the rabbits and the food preference. Use line graphs to monitor the effects of changes you make to the model, and determine which settings affect the proportion of grass to weeds when rabbits eat both.
Explore the concept of evaporative cooling through a hands-on experiment. Use a …
Explore the concept of evaporative cooling through a hands-on experiment. Use a wet cloth and fan to model an air-conditioner and use temperature and relative humidity sensors to collect data. Then digitally plot the data using graphs in the activity. In an optional extension, make your own modifications to improve the cooler's efficiency.
Build your own miniature "greenhouse" out of a plastic container and plastic …
Build your own miniature "greenhouse" out of a plastic container and plastic wrap, and fill it with different things such as dirt and sand to observe the effect this has on temperature. Monitor the temperature using temperature probes and digitally plot the data on the graphs provided in the activity.
Discover how electricity can be converted into other forms of energy such …
Discover how electricity can be converted into other forms of energy such as light and heat. Connect resistors and holiday light bulbs to simple circuits and monitor the temperature over time. Investigate the differences in temperature between the circuit with the resistor and the circuit using the bulb.
The development of systems and network concepts for students can begin with …
The development of systems and network concepts for students can begin with this highly interactive inquiry into cell phone networks. Cell phones serve as a handy knowledge base on which to develop understanding. Each cell phone represents a node, and each phone’s address book represents an edge, or the calling relationships between cell phones. Students conceptualize the entire cell phone network by drawing a graphic that depicts each cell phone in the class as a circle (node) connected by directional lines (edges) to their classmate’s cell phones in their address book. Students are queried on the shortest pathway for calling and calling pathways when selected phones are knocked out using school and classroom scenarios.
Students then use a simulation followed by Cytoscape, visually graphing software, to model and interrogate the structure and properties of the class’s cell phone network. They investigate more advanced calling relationships and perturb the network (knock out cell towers) to reexamine the adjusted network’s properties. Advanced questions about roaming, cell towers and email focus on a deeper understanding of network behavior. Both the paper and software network exercises highlight numerous properties of networks and the activities of scientists with biological networks.
Target Audience: This is an introductory module that we recommend teaching before each of our other modules to give students a background in systems. This module can be applied easily to any content area and works best as written for students between 6th and 12th grades but can be adapted for other ages. The lessons work best when in-person with students. If you are looking for an Introduction to Systems for remote learning, please use our Systems are Everywhere module.
Repeated motion is present everywhere in nature. Learn how to 'make waves' …
Repeated motion is present everywhere in nature. Learn how to 'make waves' with your own movements using a motion detector to plot your position as a function of time, and try to duplicate wave patterns presented in the activity. Investigate the concept of distance versus time graphs and see how your own movement can be represented on a graph.
Monitor the temperature of a melting ice cube and use temperature probes …
Monitor the temperature of a melting ice cube and use temperature probes to electronically plot the data on graphs. Investigate what temperature the ice is as it melts in addition to monitoring the temperature of liquid the ice is submerged in.
In this curriculum module, students in high school life science, marine science, …
In this curriculum module, students in high school life science, marine science, and/or chemistry courses act as interdisciplinary scientists and delegates to investigate how the changing carbon cycle will affect the oceans along with their integral populations.
The oceans cover 70 percent of the planet and play a critical role in regulating atmospheric carbon dioxide through the interaction of physical, chemical, and biological processes. As a result of anthropogenic activity, a doubling of the atmospheric CO2 concentration (to 760 ppm) is expected to occur by the end of this century. A quarter of the total CO2 emitted has already been absorbed by the surface oceans, changing the marine carbonate system, resulting in a decrease in pH, a change in carbonate-ion concentrations, and a change in the speciation of macro and micronutrients. The shift in the carbonate system is already drastically affecting biological processes in the oceans and is predicted to have major consequences on carbon export to the deep ocean with reverberating effects on atmospheric CO2. Put in simple terms, ocean acidification is a complex phenomenon with complex consequences. Understanding complexity and the impact of ocean acidification requires systems thinking – both in research and in education. Scientific advancement will help us better understand the problem and devise more effective solutions, but executing these solutions will require widespread public participation to mitigate this global problem.
Through these lessons, students closely model what is occurring in laboratories worldwide and at Institute for Systems Biology (ISB) through Monica Orellana’s research to analyze the effect CO2 has on ocean chemistry, ecosystems and human societies. Students experiment, analyze public data, and prepare for a mock summit to address concerns. Student groups represent key “interest groups” and design two experiments to observe the effects of CO2 on seawater pH, diatom growth, algal blooms, nutrient availability, and/or shell dissolution.
Take a breath — where does the oxygen you inhaled come from? …
Take a breath — where does the oxygen you inhaled come from? In our changing world, will we always have enough oxygen? What is in water that supports life? What is known? How do we know what we know about our vast oceans? These are just a few of the driving questions explored in this interactive STEAM high school curriculum module.
Students in marine science, environmental science, physics, chemistry, biology, integrated science, biotechnology and/or STEAM courses can use this curriculum module in order to use real-world, big data to investigate how our “invisible forest” influences ocean and Earth systems. Students build an art project to represent their new understanding and share this with the broader community.
This 4-week set of lessons is based on the oceanographic research of Dr. Anne Thompson of Portland State University in Oregon, which focuses on the abundant ocean phytoplankton Prochlorococcus. These interdisciplinary STEAM lessons were inspired by Dr. Thompson’s lab and fieldwork as well as many beautiful visualizations of Prochlorococcus, the ocean, and Earth. Students learn about the impact and importance of Prochlorococcus as the smallest and most abundant photosynthetic organism on our planet. Through the lessons, students act as both scientists and artists as they explore where breathable oxygen comes from and consider how to communicate the importance of tiny cells to human survival.
This module is written as a phenomenon-based, Next Generation Science Standards (NGSS) three-dimensional learning unit. Each of the lessons below also has an integrated, optional Project-Based Learning component that guides students as they complete the PBL process. Students learn to model a system and also design and evaluate questions to investigate phenomena. Students ultimately learn what is in a drop of ocean water and showcase how their drop contributes to our health and the stability and dynamics of global systems.
Many factors influence the success and survival rate of a population of …
Many factors influence the success and survival rate of a population of living things. Explore several factors that can determine the survival of a population of sheep in this NetLogo model. Start with a model of unlimited grass available to the sheep and watch what happens to the sheep population! Next try to keep the population under control by removing sheep periodically. Change the birthrate, grass regrowth rate, and the amount of energy rabbits get from the grass to keep a stable population.
Measure relative humidity in the air using a simple device made of …
Measure relative humidity in the air using a simple device made of a temperature sensor, a plastic bottle, and some clay. Electronically plot the data you collect on graphs to analyze and learn from it. Experiment with different materials and different room temperatures in order to explore what affects humidity.
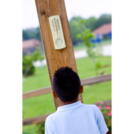
In this lesson, students will take temperature readings in the outdoor classroom, …
In this lesson, students will take temperature readings in the outdoor classroom, compare them to data from a graph, and discuss the numerical differences between the readings and the data.
In this lesson, students will take temperature readings in the outdoor classroom, …
In this lesson, students will take temperature readings in the outdoor classroom, compare them to data from a graph, and discuss the numerical differences between the readings and the data.
No restrictions on your remixing, redistributing, or making derivative works. Give credit to the author, as required.
Your remixing, redistributing, or making derivatives works comes with some restrictions, including how it is shared.
Your redistributing comes with some restrictions. Do not remix or make derivative works.
Most restrictive license type. Prohibits most uses, sharing, and any changes.
Copyrighted materials, available under Fair Use and the TEACH Act for US-based educators, or other custom arrangements. Go to the resource provider to see their individual restrictions.