This course provides an introduction to the physics and chemistry of the …
This course provides an introduction to the physics and chemistry of the atmosphere, including experience with computer codes. It is intended for undergraduates and first year graduate students.
C-ROADS is a simplified version of a climate simulator. Its primary purpose …
C-ROADS is a simplified version of a climate simulator. Its primary purpose is to help users understand the long-term climate effects (CO2 concentrations, global temperature, sea level rise) of various customized actions to reduce fossil fuel CO2 emissions, reduce deforestation, and grow more trees. Students can ask multiple, customized what-if questions and understand why the system reacts as it does.
This course introduces students to climate studies, including beginnings of the solar …
This course introduces students to climate studies, including beginnings of the solar system, time scales, and climate in human history. It is offered to both undergraduate and graduate students with different requirements.
In this scenario-based, problem-based learning (PBL) activity, students investigate cloud formation, cloud …
In this scenario-based, problem-based learning (PBL) activity, students investigate cloud formation, cloud classification, and the role of clouds in heating and cooling the Earth; how to interpret TRMM (Tropical Rainfall Measuring Mission) images and data; and the role clouds play in the Earth’s radiant budget and climate. Students assume the role of weather interns in a state climatology office and assist a frustrated student in a homework assignment. Learning is supported by a cloud in a bottle and an ice-albedo demonstration, a three-day cloud monitoring outdoor activity, and student journal assignments. The hands-on activities require two 2-liter soda bottles, an infrared heat lamp, and two thermometers. The resource includes a teacher's guide, questions and answer key, assessment rubric, glossary, and an appendix with information supporting PBL in the classroom.
This video illustrates how atmospheric particles, or aerosols (such as black carbon, …
This video illustrates how atmospheric particles, or aerosols (such as black carbon, sulfates, dust, fog), can affect the energy balance of Earth regionally, and the implications for surface temperature warming and cooling.
An activity focusing on black carbon. This activity explores the impacts of …
An activity focusing on black carbon. This activity explores the impacts of the use of black carbon generating wood, dung, and charcoal for fuel in developing countries.
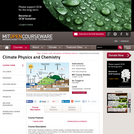
This course provides an introduction to the atmospheric chemistry involved in climate …
This course provides an introduction to the atmospheric chemistry involved in climate change, air pollution and biogeochemical cycles using a combination of hands-on laboratory, field studies, and simple computer models. Lectures will be accompanied by field trips to collect air samples for the analysis of gases, aerosols and clouds by the students.
In this activity, student teams explore connections between parts of the Earth …
In this activity, student teams explore connections between parts of the Earth system, by examining a time series of environmental data maps. By examining scientific visualizations of a data pair in two time slices, they will see that the environment is the result of the interplay among many processes that take place on varying time and spatial scales. This is one of six interrelated learning activities associated with the GLOBE Earth System Poster, Exploring Connections in Year 2007, which also includes a series of assessment and extension activities. GLOBE (Global Learning and Observation to Benefit the Environment) is a worldwide, hands-on, K-12 school-based science education program.
In this activity, student teams explore connections between parts of the Earth …
In this activity, student teams explore connections between parts of the Earth system, by examining a time series of environmental data maps. Each team examines a single variable displayed on a global data map, and identify the unit of measure, the range of values, and patterns they observe in the data. Variables include: insolation, surface temperature, precipitation, cloud fraction, aerosols, biopshere. This is one of six interrelated learning activities associated with the GLOBE Earth System Poster, "Exploring Connections in Year 2007," and includes a series of assessment and extension activities. GLOBE (Global Learning and Observation to Benefit the Environment) is a worldwide, hands-on, K-12 school-based science education program.
This resource describes the physics behind the formation of clouds, and provides …
This resource describes the physics behind the formation of clouds, and provides a demonstration of those principles using a beaker, ice, a match, hot water, and a laser pointer. This resource is from PUMAS - Practical Uses of Math and Science - a collection of brief examples created by scientists and engineers showing how math and science topics taught in K-12 classes have real world applications.
Students use real satellite data to determine 1) where the greatest concentrations …
Students use real satellite data to determine 1) where the greatest concentrations of aerosols are located during the course of a year in the tropical Atlantic region and 2) their source of origin. This is an inquiry-style lesson where students pull real aerosol data and attempt to identify trends among data sets.
In this Earth Exploration Toolbook chapter, students select, explore, and analyze satellite …
In this Earth Exploration Toolbook chapter, students select, explore, and analyze satellite imagery. They do so in the context of a case study of the origins of atmospheric carbon monoxide and aerosols, tiny solid airborne particles such as smoke from forest fires and dust from desert wind storms. They use the software tool ImageJ to animate a year of monthly images of aerosol data and then compare the animation to one created for monthly images of carbon monoxide data. Students select, explore, and analyze satellite imagery using NASA Earth Observatory (NEO) satellite data and NEO Image Composite Explorer (ICE) tool to investigate seasonal and geographic patterns and variations in concentration of CO and aerosols in the atmosphere.
This is a series of 5 guided-inquiry activities that examine data and …
This is a series of 5 guided-inquiry activities that examine data and models that climate scientists use to attempt to answer the question of Earth's future climate.
No restrictions on your remixing, redistributing, or making derivative works. Give credit to the author, as required.
Your remixing, redistributing, or making derivatives works comes with some restrictions, including how it is shared.
Your redistributing comes with some restrictions. Do not remix or make derivative works.
Most restrictive license type. Prohibits most uses, sharing, and any changes.
Copyrighted materials, available under Fair Use and the TEACH Act for US-based educators, or other custom arrangements. Go to the resource provider to see their individual restrictions.