In this lesson children will be asked to make a graph, then …
In this lesson children will be asked to make a graph, then listen to a story. After the story, they will do a similar graph and then compare the two graphs.
In this multi-part activity, students study seismograms from 3 different seismic stations …
In this multi-part activity, students study seismograms from 3 different seismic stations recording the magnitude 9.0 Sumatra earthquake of December 26th, 2004. By comparing the arrival times of the P and S waves on each seismogram, students determine the distance from the epicenter to each station. Using that data, they can accurately map the location of the epicenter and the precise time of the earthquake. After locating the epicenter, students calculate the position of the tsunami generated by the quake at one hour intervals. From those determinations, predictions are made about how much time people had before the tsunami crashed onto their shores. Finally, students investigate some of the ways people can lessen the impact of the next great tsunami.
(Note: this resource was added to OER Commons as part of a batch upload of over 2,200 records. If you notice an issue with the quality of the metadata, please let us know by using the 'report' button and we will flag it for consideration.)
Presentations, materials and other resources offered throughout the 2019 Continuous Quality Improvement …
Presentations, materials and other resources offered throughout the 2019 Continuous Quality Improvement Statewide Conference for Child Welfare and Probation at UC Davis.
This online course is designed to help anyone teach – and learn …
This online course is designed to help anyone teach – and learn – with a 21st century approach to knowledge and teaching. Lesson 1 of the course shares important evidence we now have about the working of the brain, that is meaningful for all subjects and ages – and lives. We then move to thinking together about the data filled world in which we live, to prepare students for their future in a world of data. The aim of a data science approach is not to add new standards or content to your teaching, it is about interacting with your content in a data science way – that is fun, interesting and creative. In the course you will experience lessons that you can take and use with your students, and you will see lots of classroom and lesson examples. Whether you are a kindergarten teacher, a high school history or maths teacher, an administrator or parent, or someone just curious about data science, there will be ideas for you.
Coders use a variety of blocks and sprites to create an interactive …
Coders use a variety of blocks and sprites to create an interactive diorama about their predictions for the future. The purpose of this project is to apply previously learned concepts in a new context (e.g., modifying sprites, parallelism, events, etc.).
After completing the various activities in this lesson, students will be able …
After completing the various activities in this lesson, students will be able to understand the importance for a healthy body to be able to do an activity for 1 - 5 minutes.
This resource is a video abstract of a research paper created by …
This resource is a video abstract of a research paper created by Research Square on behalf of its authors. It provides a synopsis that's easy to understand, and can be used to introduce the topics it covers to students, researchers, and the general public. The video's transcript is also provided in full, with a portion provided below for preview:
"When modern 3D printing was invented in the early 1980s, few could have predicted the influence it has today. At no other time in history has it been this easy to transform a sketch into the real thing. And while that feat has proven immensely useful for constructing complex machines, it is unlikely more meaningful anywhere else today than in the field of biomedicine. With the ability to churn out standard or custom prosthetics, devices, and even test models, the 3D printing of biomaterials is revolutionizing medical care. One of the greatest conveniences afforded by biomedical 3D printing is the ability to manufacture parts on demand. Common load-bearing prosthetics, such as those for knee or hip replacements, no longer have to be built in bulk and benched before use. Virtually stored print files can be called upon and processed into parts as soon as they are needed in the clinic, with the printing material and method suited to the part’s function and placement..."
The rest of the transcript, along with a link to the research itself, is available on the resource itself.
Coders will solve four different maze challenges that focus on a combination …
Coders will solve four different maze challenges that focus on a combination of vertical and horizontal movement, then create their own unique mazes that peers will solve. The purpose of this project is to reinforce understanding of predicting and sequencing a sprite’s movement using the motion blocks.
In this plate tectonics and rock cycling unit, students come to see …
In this plate tectonics and rock cycling unit, students come to see that the Earth is much more active and alive than they have thought before. The unit launches with documentation of a 2015 Himalayan earthquake that shifted Mt. Everest suddenly to the southwest direction. Students read texts, explore earthquake and landform patterns using a data visualization tool, and study GPS data.
This unit is part of the OpenSciEd core instructional materials for middle school.
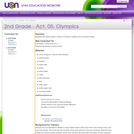
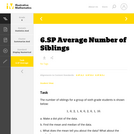
This is a task from the Illustrative Mathematics website that is one …
This is a task from the Illustrative Mathematics website that is one part of a complete illustration of the standard to which it is aligned. Each task has at least one solution and some commentary that addresses important aspects of the task and its potential use.
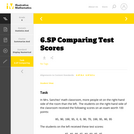
This task addresses many standards regarding the description and analysis of bivariate …
This task addresses many standards regarding the description and analysis of bivariate quantitative data, including regression and correlation. Students should recognize that the pattern shown is one of a strong, positive, linear association, and thus a correlation coefficient value near +1 is plausible. Students should also be able to interpret the slope of the least-squares line as an estimated increase in y per unit change in x (and thus for a 3 unit increase in x, students should expect an estimated increase in y that equals 3 times the model's slope value).
No restrictions on your remixing, redistributing, or making derivative works. Give credit to the author, as required.
Your remixing, redistributing, or making derivatives works comes with some restrictions, including how it is shared.
Your redistributing comes with some restrictions. Do not remix or make derivative works.
Most restrictive license type. Prohibits most uses, sharing, and any changes.
Copyrighted materials, available under Fair Use and the TEACH Act for US-based educators, or other custom arrangements. Go to the resource provider to see their individual restrictions.