This activity has students use Fathom to test the correlation between attendance …
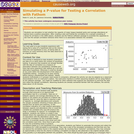
This activity has students use Fathom to test the correlation between attendance and ballpark capacity of major league baseball teams by taking a sample of actual data and scrambling one of the variables to see how the correlation behaves when the variables are not related. After displaying the distribution of correlations for many simulated samples, students find an approximate p-value based on the number of simulations that exceed the actual correlation.
TED Studies, created in collaboration with Wiley, are curated video collections …
TED Studies, created in collaboration with Wiley, are curated video collections supplemented by rich educational materials for students, educators and self-guided learners. In Visualizing Data, TED speakers shake up statistics with elegant, dynamic representations that make mountains of data comprehensible and even exciting. Learn how to visualize data and present complicated statistics in elegant and captivating ways. Relevant areas of interest, study and coursework include: information design, demography, statistical literacy, economics, sociology, media studies, linguistics, meteorology and computer science.
No restrictions on your remixing, redistributing, or making derivative works. Give credit to the author, as required.
Your remixing, redistributing, or making derivatives works comes with some restrictions, including how it is shared.
Your redistributing comes with some restrictions. Do not remix or make derivative works.
Most restrictive license type. Prohibits most uses, sharing, and any changes.
Copyrighted materials, available under Fair Use and the TEACH Act for US-based educators, or other custom arrangements. Go to the resource provider to see their individual restrictions.