Read the Fine Print
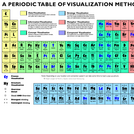
The Periodic Table of Visualization Methods organizes a broad variety of visual representations by specific information problems. This interactive tool includes definitions and models of data, information, concept, strategy, metaphor, compound, process and structure visualization.
- Subject:
- Applied Science
- Arts and Humanities
- Computer Science
- Material Type:
- Diagram/Illustration
- Provider:
- eLearning Lab USI
- Provider Set:
- Visual Literacy
- Author:
- Martin J. Eppler
- Ralph Lengler
- Date Added:
- 09/01/2011