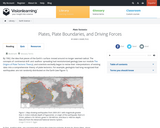
Show caption HideA critical component of this activity involves sharing team data …
Show caption HideA critical component of this activity involves sharing team data with the entire class, done the old-fashioned way on the chalkboard. Details This activity begins with an exploration of a topographic map of the earth, ending with the question: Why is the distribution of topography on the earth bimodal? The students then collect two forms of data. They measure the density of the most common rocks that make up oceanic crust (basalt), continental crust (granite), and the mantle (peridotite). They also measure the density of several different kinds of wood, and how high each kind floats in a tub of water. In each case, they work in teams of two or three and then the entire class shares their data. Based on the data from the wood, they derive an equation that relates the density of the wood to the height at which the block floats in the water - the isostasy equation. They then substitute density values for real rocks into their equation to derive thicknesses for average continental and oceanic crust, and apply their knowledge in order to draw a cross-section of the crust across South America. This activity gives students a real, hands-on and mathematical understanding of the principle of isostasy.
(Note: this resource was added to OER Commons as part of a batch upload of over 2,200 records. If you notice an issue with the quality of the metadata, please let us know by using the 'report' button and we will flag it for consideration.)
This lesson discusses the interior structure of the earth as defined by …
This lesson discusses the interior structure of the earth as defined by research on the behavior of seismic waves as they move through the layers inside of the planet. The lesson details both compositional layers as well as mechanical layers.
This module explores the composition of the earth's atmosphere, how temperature and …
This module explores the composition of the earth's atmosphere, how temperature and pressure vary in the atmosphere, and the scientific developments that led to an understanding of these basic concepts.
In this activity, students work in groups to put a set of …
In this activity, students work in groups to put a set of cartoon cards in order, much in the way that we might assemble a geologic history. The primary goal of the activity is to explore the nature of science in general and the nature of geoscience or historical science specifically, without requiring any content knowledge.
(Note: this resource was added to OER Commons as part of a batch upload of over 2,200 records. If you notice an issue with the quality of the metadata, please let us know by using the 'report' button and we will flag it for consideration.)
Students are introduced to sedimentary rocks through field observations and measurements of …
Students are introduced to sedimentary rocks through field observations and measurements of sediments in different environments. This allows them to proceed from processes to products and engages them through field work in the local area.
(Note: this resource was added to OER Commons as part of a batch upload of over 2,200 records. If you notice an issue with the quality of the metadata, please let us know by using the 'report' button and we will flag it for consideration.)
This module discusses the hydrologic cycle and its impacts on the planet …
This module discusses the hydrologic cycle and its impacts on the planet Earth. Additionally, the module addresses connections between the hydrologic cycle, climate and the impacts humans have had on the cycle.
In this activity, students are introduced to the methods of inquiry in …
In this activity, students are introduced to the methods of inquiry in the Earth sciences and how they differ from what is classically taught in school science.
This activity is a mini-research project in which students independently investigate the …
This activity is a mini-research project in which students independently investigate the variety of natural resources mined from the Earth and the broader implications of this mining. Students then give very short presentations of their findings to the class as a whole.
(Note: this resource was added to OER Commons as part of a batch upload of over 2,200 records. If you notice an issue with the quality of the metadata, please let us know by using the 'report' button and we will flag it for consideration.)
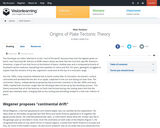
The distribution of earthquakes and volcanoes around the world confirmed the theory …
The distribution of earthquakes and volcanoes around the world confirmed the theory of plate tectonics first proposed by Wegener. These phenomena also help categorize plate boundaries into three different types: convergent, divergent, and transform.
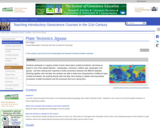
This activity is a slight variation on an original activity, Discovering Plate …
This activity is a slight variation on an original activity, Discovering Plate Boundaries, developed by Dale Sawyer at Rice University. I made different maps, including more detail in all of the datasets, and used a different map projection, but otherwise the general progression of the activity is the same. More information about jigsaw activities in general can be found in the Jigsaws module.
The activity occurs in several sections, which can be completed in one or multiple classes. In the first section, students are divided into "specialist" groups, and each group is given a global map with a single dataset: global seismicity, volcanoes, topography, age of the seafloor, and free-air gravity. Each student is also given a map of plate boundaries. Their task in the specialist group is to become familiar with their dataset and develop categories of plate boundaries based only on their dataset. Each group then presents their results to the class.
In the second section, students reorganize into groups with 1-2 of each type of specialist per group. Each new group is given a plate, and they combine their different datasets on that one plate and look for patterns. Again, each plate group presents to the class. The common patterns and connections between the different datasets quickly become apparent, and the final section of the activity involves a short lecture from the instructor about types of plate boundaries and why the common features are generated at those plate boundaries. A follow-up section or class involves using a problem-solving approach to explain the areas that don't "fit" into the typical boundary types - intra-plate volcanism, earthquakes in the Eastern California Shear Zone, etc.
(Note: this resource was added to OER Commons as part of a batch upload of over 2,200 records. If you notice an issue with the quality of the metadata, please let us know by using the 'report' button and we will flag it for consideration.)
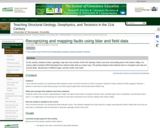
In this activity, students create a geologic map and cross-section of the …
In this activity, students create a geologic map and cross-section of the Fish Springs cinder cone and surrounding area in the Owens Valley, CA, using a high-resolution DEM developed from airborne lidar data as a base map. The primary features that students learn to recognize and map are normal faults, alluvial fans of different ages, and the cinder cone itself.
(Note: this resource was added to OER Commons as part of a batch upload of over 2,200 records. If you notice an issue with the quality of the metadata, please let us know by using the 'report' button and we will flag it for consideration.)
This activity introduces students to using real-time data about earthquakes to make …
This activity introduces students to using real-time data about earthquakes to make decisions.
(Note: this resource was added to OER Commons as part of a batch upload of over 2,200 records. If you notice an issue with the quality of the metadata, please let us know by using the 'report' button and we will flag it for consideration.)
This module describes the purpose of using graphs and other data visualization …
This module describes the purpose of using graphs and other data visualization techniques and describes a simple three-step process that can be used to understand and extract information from graphs.
No restrictions on your remixing, redistributing, or making derivative works. Give credit to the author, as required.
Your remixing, redistributing, or making derivatives works comes with some restrictions, including how it is shared.
Your redistributing comes with some restrictions. Do not remix or make derivative works.
Most restrictive license type. Prohibits most uses, sharing, and any changes.
Copyrighted materials, available under Fair Use and the TEACH Act for US-based educators, or other custom arrangements. Go to the resource provider to see their individual restrictions.