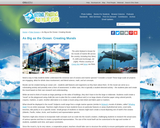
Student teams investigate Arctic Sea Ice by analyzing actual data and making …
Student teams investigate Arctic Sea Ice by analyzing actual data and making predictions. A worthwhile extension is to predict the first year that the Arctic Ocean will be ice free.
(Note: this resource was added to OER Commons as part of a batch upload of over 2,200 records. If you notice an issue with the quality of the metadata, please let us know by using the 'report' button and we will flag it for consideration.)
This article describes several traditional Inuit games and provides background information and …
This article describes several traditional Inuit games and provides background information and resources for incorporating them into a lesson or unit on Inuit culture.
In this audio slideshow, an ecologist from the University of Florida describes …
In this audio slideshow, an ecologist from the University of Florida describes the radiocarbon dating technique that scientists use to determine the amount of carbon within the permafrost of the Arctic tundra. Understanding the rate of carbon released as permafrost thaws is necessary to understand how this positive feedback mechanism is contributing to climate change that may further increase global surface temperatures.
This article assembles free resources from the Arctic and Antarctic Birds issue …
This article assembles free resources from the Arctic and Antarctic Birds issue of the Beyond Penguins and Polar Bears cyberzine into a unit outline based on the 5E learning cycle framework. Outlines are provided for Grades K-2 and 3-5.
In this short video, host Dr. Ryan interviews graduate student Amy Steiker …
In this short video, host Dr. Ryan interviews graduate student Amy Steiker at the Institute of Arctic and Alpine Research about her research, using isotopes of nitrous oxide, connecting human activity to greenhouse gas emissions.
This article and slide show from the New York Times, features several …
This article and slide show from the New York Times, features several scientists from the University of Alaska, Fairbanks, who study the effects of thawing permafrost in Alaska.
Using Landsat 8 imagery from before and after the 2015 wildfire season …
Using Landsat 8 imagery from before and after the 2015 wildfire season in Glacier National Park, Montana, learners calculate the damage using a Normalized Burn Index, digitize the burn area, and publish to ArcGIS Online.
This easy-to-understand video animation describes drought and explains the different categories of …
This easy-to-understand video animation describes drought and explains the different categories of drought used by the drought monitor. It discusses the effects of and contributions to drought, what the implications of the different drought levels are, and puts the drought maps into context to understand how the impacts vary geographically (e.g. drought in Nevada vs Kansas - one could affect tourism, the other agriculture). It also touches on how the development of maps/drought severity is determined and how it might vary geographically. The animation provides a basic overview of statistics and percentiles and the concept of '100 year events.'
Students will read primary scientific literature, work collaboratively, think critically, and utilize …
Students will read primary scientific literature, work collaboratively, think critically, and utilize GIS as a tool to visualize and quantify spatial and temporal changes in hydrological systems.
(Note: this resource was added to OER Commons as part of a batch upload of over 2,200 records. If you notice an issue with the quality of the metadata, please let us know by using the 'report' button and we will flag it for consideration.)
This activity introduces students to an actual data set that explores the …
This activity introduces students to an actual data set that explores the impacts of ocean acidification on tropical coral reef ecosystems. Students are first given a scenario for a field site in the Caribbean and are asked to design an experiment that answers the question: How will a decline in surface ocean pH by the 21st century impact tropical coral growth? Students then gather actual data (from coral images collected from the field site) to calculate calcification rates of different coral samples. Finally, students use the provided saturation state values to predict the extent to which coral calcification is expected to decline by the 21st century.
This article provides an overview of using rubrics as a method of …
This article provides an overview of using rubrics as a method of assessment and discusses technological tools that facilitate the creation of rubrics.
This article reprints and links to informational text about the adaptations that …
This article reprints and links to informational text about the adaptations that allow mammals and fish to survive in polar oceans. Versions are available for students in grades K-1, 2-3 and 4-5. Related science and literacy activities are included.
In this activity, students explore the web-based U.S. Forest Service Climate Change …
In this activity, students explore the web-based U.S. Forest Service Climate Change Atlas to learn about projected climate changes in their state and how suitable habitat for tree and bird species is projected to change by 2100.
This undergraduate class is designed to introduce students to the physics that …
This undergraduate class is designed to introduce students to the physics that govern the circulation of the ocean and atmosphere. The focus of the course is on the processes that control the climate of the planet. Acknowledgments Prof. Ferrari wishes to acknowledge that this course was originally designed and taught by Prof. John Marshall.
These graphs show carbon dioxide measurements at the Mauna Loa Observatory, Hawaii. …
These graphs show carbon dioxide measurements at the Mauna Loa Observatory, Hawaii. The graphs display recent measurements as well as historical long term measurements. The related website summarizes in graphs the recent monthly CO2, the full CO2 Record, the annual Mean CO2 Growth Rate, and gives links to detailed CO2 data for this location, which is one of the most important CO2 tracking sites in the world.
This course provides a detailed overview of the chemical transformations that control …
This course provides a detailed overview of the chemical transformations that control the abundances of key trace species in the Earth's atmosphere. Emphasizes the effects of human activity on air quality and climate. Topics include photochemistry, kinetics, and thermodynamics important to the chemistry of the atmosphere; stratospheric ozone depletion; oxidation chemistry of the troposphere; photochemical smog; aerosol chemistry; and sources and sinks of greenhouse gases and other climate forcers.
No restrictions on your remixing, redistributing, or making derivative works. Give credit to the author, as required.
Your remixing, redistributing, or making derivatives works comes with some restrictions, including how it is shared.
Your redistributing comes with some restrictions. Do not remix or make derivative works.
Most restrictive license type. Prohibits most uses, sharing, and any changes.
Copyrighted materials, available under Fair Use and the TEACH Act for US-based educators, or other custom arrangements. Go to the resource provider to see their individual restrictions.