Map of Africa coded by the number of underweight children per square …
Map of Africa coded by the number of underweight children per square kilometer. It is thus a measure of the absolute density of hungry individuals, a combination of hunger and population density.
The goal of this exercise is to examine the relationship between cultural …
The goal of this exercise is to examine the relationship between cultural identities and partisanship, vote choice, and liberal social policies. Crosstabulation, frequencies, and charts will be used.
Map of Asia color coded by infant mortality rate broken down by …
Map of Asia color coded by infant mortality rate broken down by nation or subnational units (akin to US states or Canadian provinces). Shows the international differences, but also shows the (less substantial) differences within nations. The categories for the color coding have been changed slightly from the international standards to better fit the situation in Asia.
Map of Europe color coded by infant mortality rate broken down by …
Map of Europe color coded by infant mortality rate broken down by nation or subnational units (akin to US states or Canadian provinces). Shows the international differences, but also shows the (less substantial) differences within nations. The categories for the color coding have been changed from the international standards to differentiate among the universally low infant mortality rates across Europe.
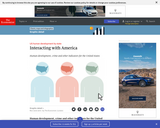
"Interacting With America" is comprised of rich data on human development in …
"Interacting With America" is comprised of rich data on human development in the US that readers can explore through a clearly depicted, interactive map on health, wealth and education in the 50 states. Teachers and students alike can draw comparisons between states through the use of the intuitively constructed histograms which display the human development indexes measured for each state.
The goal of this exercise is to learn more about intergroup relationships …
The goal of this exercise is to learn more about intergroup relationships and to explore the role intergroup friendships play in perceptions of out-group members. Crosstabulation will be used.
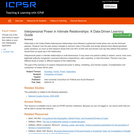
The IMF publishes a range of time series data on IMF lending, …
The IMF publishes a range of time series data on IMF lending, exchange rates and other economic and financial indicators. Manuals, guides, and other material on statistical practices at the IMF, in member countries, and of the statistical community at large are also available. The data mapper allows the user to view IMF data in a variety of ways using differing indicators.
The goal of this exercise is to explore interpersonal power in dating, …
The goal of this exercise is to explore interpersonal power in dating, cohabiting, and married couples. Crosstabulation and comparison of means will be used.
The goal of this exercise is to use triangulation to investigate bias …
The goal of this exercise is to use triangulation to investigate bias and measurement validity in parents/teachers evaluations of student health and learning.
Modern Westerners brought up on a steady diet of popular songs and …
Modern Westerners brought up on a steady diet of popular songs and romantic movies tend to believe that interpersonal attraction and mate selection are both random and very subjective. Popular culture propagates the notion of "love at first sight" and teaches us that "love is blind, "love just happens," and "you can't help who you fall in love with." Research shows, however, that this is not necessarily true and that, in reality, society aims Cupid's arrow more than we like to think. In this exercise we explore the concepts of homogamy, routine activities, social networks, and mere exposure by examining how similar respondents are to their partners on a variety of social characteristics and how they met and became involved with their partners.
The goal of this exercise is to examine the process of issue …
The goal of this exercise is to examine the process of issue evolution by comparing partisan boundaries across several issues. Crosstabulation and correlation coefficients will be used.
JUNG ??? the Java Universal Network/Graph Framework--is a software library that provides …
JUNG ??? the Java Universal Network/Graph Framework--is a software library that provides a common and extensive language for the modeling, analysis, and visualization of data that can be represented as a graph or network.
The goal of this exercise is to determine whether the realities of …
The goal of this exercise is to determine whether the realities of women's lives in the 1950s match the idealized view of that time period we have today. Crosstabulation and comparison of means will be used.
A national leader in civic education, Kids Voting USA?? (KVUSA) gets students …
A national leader in civic education, Kids Voting USA?? (KVUSA) gets students involved and ready to be educated, engaged citizens. Students learn about democracy through a combination of classroom activities, an authentic voting experience and family dialogue.
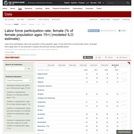
Data set and map pertaining to labor force participation rates for women …
Data set and map pertaining to labor force participation rates for women in all countries. The World Bank specifies female labor force participation as a World Development Indicator (WDI) -- the statistical benchmark that helps measure the progress of development.
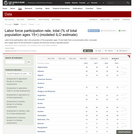
Data set and map pertaining to total labor force participation rates for …
Data set and map pertaining to total labor force participation rates for all countries. The World Bank specifies labor force participation as a World Development Indicator (WDI) -- the statistical benchmark that helps measure the progress of development.
No restrictions on your remixing, redistributing, or making derivative works. Give credit to the author, as required.
Your remixing, redistributing, or making derivatives works comes with some restrictions, including how it is shared.
Your redistributing comes with some restrictions. Do not remix or make derivative works.
Most restrictive license type. Prohibits most uses, sharing, and any changes.
Copyrighted materials, available under Fair Use and the TEACH Act for US-based educators, or other custom arrangements. Go to the resource provider to see their individual restrictions.