This document includes two activities related to earthquake base isolation. Learners explore …
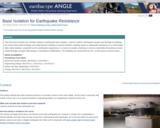
This document includes two activities related to earthquake base isolation. Learners explore earthquake hazards and damage to buildings by constructing model buildings and subjecting the buildings to ground vibration (shaking similar to earthquake vibrations) on a small shake table. Base isolation a powerful tool for earthquake engineering. It is meant to enable a building to survive a potentially devastating seismic impact through a proper initial design or subsequent modifications. The buildings are constructed by two- or three-person learner teams.
(Note: this resource was added to OER Commons as part of a batch upload of over 2,200 records. If you notice an issue with the quality of the metadata, please let us know by using the 'report' button and we will flag it for consideration.)
This is an Excel spreadsheet and graph that illustrates standard "batch" and …
This is an Excel spreadsheet and graph that illustrates standard "batch" and Rayleigh decarbonation models and how they can be used to detect fluid infiltration during metamorphism of carbonates. It makes a good lecture demonstration, but with a few modifications can be turned into a laboratory exercise. Key variables are "hotlinked" directly into the batch and Rayleigh models so students can adjust them to get a feel for the influence of different model parameters. The included carbon isotope data are from marbles in the Jervois region, central Australia (Cartwright et al., 1997). Oxygen isotope data are also included in the spreadsheet.
(Note: this resource was added to OER Commons as part of a batch upload of over 2,200 records. If you notice an issue with the quality of the metadata, please let us know by using the 'report' button and we will flag it for consideration.)
Beginning kindergarteners are introduced to science and engineering concepts through questions such …
Beginning kindergarteners are introduced to science and engineering concepts through questions such as “What is a Scientist?” and “What is an Engineer?”, and go on to compare and contrast the two. They are introduced to five steps of the engineering design process and explore these steps using the “I do, we do, you do” set of guided instruction. At the end of the project, students produce a set of purple popsicles that they design using various materials and by following a set of criteria.
In this activity, kids will work on two fundamental early math skills …
In this activity, kids will work on two fundamental early math skills – sorting/classifying, and graphing. There will also be some great fine motor skill practice! Includes place-based discussion questions, activity instructions, extension activities, songs, and student graph worksheets.
NGSS: K-LS1-1, 1-LS1-1, partially meets K-ESS3-1 (book and discussion)
Common Core: MP.4
Time: 45 minutes
Matierals: bag of dried beans ("16 bean soup"), paper bowls, glue, chart paper, the book "One Bean" or similar book about growing food plants, especially beans.
Students are given the task of predicting where parasequence boundaries would exist …
Students are given the task of predicting where parasequence boundaries would exist within a vertical section of the Blackhawk Formation, Utah. This activity challenges students to apply their knowledge of bedforms in order to interpret the facies they observe. The students work in groups of two as they make their observations. The vertical section consists of four main outcrops to be observed by the students. After making their observations and interpretations of these four outcrops, the students then make predictions of what should be found up section. Students begin down section by observing the lowest section of the four outcrops. The students make observations about lithology, grain size, sedimentary structures and trace fossils. After recording their observations in their field notebook the class gathers for a discussion. Students are called on randomly to discuss what they observed. The class creates a group stratigraphic column on a white board and includes their observations to the right of the drawn profile. They are then asked to interpret what facies these observations represent. The students defend their interpretations and, as a group, agree upon an interpretation. The facies interpretation is then added to the white board and the group moves to the next outcrop up section. After observing, describing and interpreting each of the four outcrops the students are challenged to use all of the information gathered thus far to predict what facies should be observed further up section. This exercise provides an opportunity for the students to make and defend observations and interpretations. They also get a sense for the importance of Walther's Law and how it relates to sequence stratigraphy.
(Note: this resource was added to OER Commons as part of a batch upload of over 2,200 records. If you notice an issue with the quality of the metadata, please let us know by using the 'report' button and we will flag it for consideration.)
In this exercise, students will use the Neotoma database and ArcGIS Online …
In this exercise, students will use the Neotoma database and ArcGIS Online to create a distribution map of modern collection localities of beetle taxa associated with an assemblage of fossil beetles from the Conklin Quarry site in eastern Iowa.
a data rich exercise to help students discover how organisms move in response to climate change
(Note: this resource was added to OER Commons as part of a batch upload of over 2,200 records. If you notice an issue with the quality of the metadata, please let us know by using the 'report' button and we will flag it for consideration.)
Companion Site for Harvard Medical School Canvas Network MOOC Best Practices for …
Companion Site for Harvard Medical School Canvas Network MOOC Best Practices for Biomedical Research Data Management. This Open Science Framework project site includes all the materials contained in the Canvas course including: readings and resources; slide presentations; video lectures; activity outlines; research case studies and questions; and quiz questions with answer guide.
Biomedical research today is not only rigorous, innovative and insightful, it also …
Biomedical research today is not only rigorous, innovative and insightful, it also has to be organized and reproducible. With more capacity to create and store data, there is the challenge of making data discoverable, understandable, and reusable. Many funding agencies and journal publishers are requiring publication of relevant data to promote open science and reproducibility of research.
In order to meet to these requirements and evolving trends, researchers and information professionals will need the data management and curation knowledge and skills to support the access, reuse and preservation of data.
This course is designed to address present and future data management needs.
Students act as if they are biological engineers following the steps of …
Students act as if they are biological engineers following the steps of the engineering design process to design and create protein models to replace the defective proteins in a child’s body. Jumping off from a basic understanding of DNA and its transcription and translation processes, students learn about the many different proteins types and what happens if protein mutations occur. Then they focus on structural, transport and defense proteins during three challenges posed by the R&D; bio-engineering hypothetical scenario. Using common classroom supplies such as paper, tape and craft sticks, student pairs design, sketch, build, test and improve their own protein models to meet specific functional requirements: to strengthen bones (collagen), to capture oxygen molecules (hemoglobin) and to capture bacteria (antibody). By designing and testing physical models to accomplish certain functional requirements, students come to understand the relationship between protein structure and function. They graph and analyze the class data, then share and compare results across all teams to determine which models were the most successful. Includes a quiz, three worksheets and a reference sheet.
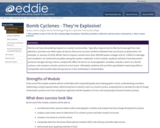
Students learn how to manipulate the behavior of water by using biochar—a …
Students learn how to manipulate the behavior of water by using biochar—a soil amendment used to improve soil functions. As a fluid, water interacts with soil in a variety of ways. It may drain though a soil’s non-solid states, or its “pores”; lay above the soil; or move across cell membranes via osmosis. In this experiment, students solve the specific problem of standing water by researching, designing, and engineering solutions that enable water to drain faster. This activity is designed for students to explore how biochar helps soils to act as “sponges” in order to retain more water.
This resource was created by Brandon Horst in collaboration with Tina Williams …
This resource was created by Brandon Horst in collaboration with Tina Williams as part of the 2019-20 ESU-NDE Digital Age Pedagogy Project. Educators worked with coaches to create Unit Plans promoting BlendEd Learning Best Practices. This Unit Plan is designed for Upper Primary Integrated Technology (3-5).
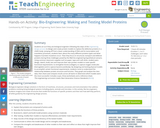
Students learn how engineers gather data and model motion using vectors. They …
Students learn how engineers gather data and model motion using vectors. They learn about using motion-tracking tools to observe, record, and analyze vectors associated with the motion of their own bodies. They do this qualitatively and quantitatively by analyzing several examples of their own body motion. As a final presentation, student teams act as engineering consultants and propose the use of (free) ARK Mirror technology to help sports teams evaluate body mechanics. A pre/post quiz is provided.
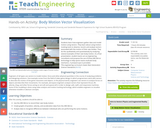
Storms can have devastating impacts on coastal communities. Typically, tropical storms like …
Storms can have devastating impacts on coastal communities. Typically, tropical storms like hurricanes get the most attention, but there are other types of storms that occur at more northern latitudes that can be just as destructive. For example, in January of 2018, Winter Storm Grayson caused more than 300,000 power outages and $1.1 billion in damage, and resulted in 22 confirmed casualties along the eastern seaboard. In this module, students will learn how barometric pressure changes during a storm, analyze the effect of storms on oceanographic variables, classify a storm as a bomb cyclone, and compare a bomb cyclone to a hurricane. Ultimately students will use their quantitative reasoning skills to manipulate and visualize data during storms in the northeastern United States.
(Note: this resource was added to OER Commons as part of a batch upload of over 2,200 records. If you notice an issue with the quality of the metadata, please let us know by using the 'report' button and we will flag it for consideration.)
Preparation requires lecture and/or reading material on stereonet methods in plotting small …
Preparation requires lecture and/or reading material on stereonet methods in plotting small circles, and on making stereonet rotations along small circles. In lab, students are given a description of the problem, along with a schematic cross section on the blackboard showing how the dip of the eastern fold limb is not constrained, but how the orientation of cross beds in an unoriented core are the only data available to help constrain the dip of the fold limb. Students are then given a while (~20 minutes) to think about and discuss how a solution can be made. An open class discussion follows, and then I guide the students through the answer. An alternative method is to let the students take a week to think about and solve the problem with little or no help.
(Note: this resource was added to OER Commons as part of a batch upload of over 2,200 records. If you notice an issue with the quality of the metadata, please let us know by using the 'report' button and we will flag it for consideration.)
Question In many high-grade metamorphic belts around the world, rocks were buried …
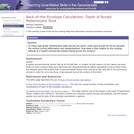
Question In many high-grade metamorphic belts around the world, rocks were buried 20-30 km beneath the surface during deformation and metamorphism. How deep is that relative to the cruising altitude of a typical commercial airplane flying across the country?
(Note: this resource was added to OER Commons as part of a batch upload of over 2,200 records. If you notice an issue with the quality of the metadata, please let us know by using the 'report' button and we will flag it for consideration.)
Question Over the last 70 million years or so, the Hawaiian Hot …
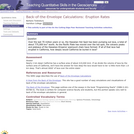
Question Over the last 70 million years or so, the Hawaiian Hot Spot has been pumping out lava, a total of about 775,000 km3 worth. As the Pacific Plate has moved over the hot spot, the volcanic peaks and plateaus of the Hawaiian-Emperor seamount chain have formed. If all of that lava had erupted in California, how deeply would California be buried in lava?
(Note: this resource was added to OER Commons as part of a batch upload of over 2,200 records. If you notice an issue with the quality of the metadata, please let us know by using the 'report' button and we will flag it for consideration.)
Question Suppose that you are building a new house. It will take …
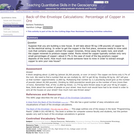
Question Suppose that you are building a new house. It will take about 90 kg (198 pounds) of copper to do the electrical wiring. In order to get the copper in the first place, someone needs to mine solid rock that contains copper, extract the copper minerals, throw away the waste rock, and smelt the copper minerals to produce copper metal. Rocks mined for copper typically contain only very small percentages of copper -- about 0.7% in the case of most of the big porphyry copper deposits of the world. How much rock would someone have to mine in order to extract enough copper to wire your new house?
(Note: this resource was added to OER Commons as part of a batch upload of over 2,200 records. If you notice an issue with the quality of the metadata, please let us know by using the 'report' button and we will flag it for consideration.)
Question In 1983, an eruption began at Kilauea Volcano in Hawaii that …
Question In 1983, an eruption began at Kilauea Volcano in Hawaii that has proved to be the largest and longest-lived eruption since records began in 1823. Lava has poured out of the volcano at an average rate of about 160 million m3 per year. To put those flow rates into perspective, let's suppose that the volcano was erupting directly into your classroom. At these flow rates, how long would it take to fill your classroom with lava?
(Note: this resource was added to OER Commons as part of a batch upload of over 2,200 records. If you notice an issue with the quality of the metadata, please let us know by using the 'report' button and we will flag it for consideration.)
Question Let's suppose that you have a shoe box full of water …
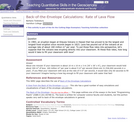
Question Let's suppose that you have a shoe box full of water (the box is waterproof, of course). The shoe box weighs about 9 kg (19.8 pounds). Suppose you emptied the box and filled it completely with rock (little or no air space). How much would it weigh? Let's empty the box again and fill it completely with pure gold. How much would the box weigh now?
(Note: this resource was added to OER Commons as part of a batch upload of over 2,200 records. If you notice an issue with the quality of the metadata, please let us know by using the 'report' button and we will flag it for consideration.)
No restrictions on your remixing, redistributing, or making derivative works. Give credit to the author, as required.
Your remixing, redistributing, or making derivatives works comes with some restrictions, including how it is shared.
Your redistributing comes with some restrictions. Do not remix or make derivative works.
Most restrictive license type. Prohibits most uses, sharing, and any changes.
Copyrighted materials, available under Fair Use and the TEACH Act for US-based educators, or other custom arrangements. Go to the resource provider to see their individual restrictions.