Updating search results...

Search Resources

886 Results

View
Selected filters:
  • CLEAN: Climate Literacy and Energy Awareness Network
ArcGIS Living Atlas - Indicators of the Planet
Read the Fine Print
Educational Use
Rating
0.0 stars

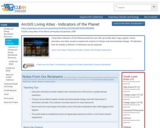
Living Atlas Indicators of the Planet provide the user with up-to-date data, maps, graphs, charts, animation and other visuals to explore the science of climate and environmental change. 18 indicators from Air Quality to Women in Parliament can be explored.

Subject:
Applied Science
Atmospheric Science
Biology
Career and Technical Education
Ecology
Environmental Science
Environmental Studies
Life Science
Oceanography
Physical Science
Material Type:
Reading
Provider:
CLEAN: Climate Literacy and Energy Awareness Network
Provider Set:
CLEAN: Climate Literacy and Energy Awareness Network
Author:
ArcGIS Living Atlas of the World community and partners
ESRI
Date Added:
07/09/2021
Arctic Climate Curriculum, Activity 1: Exploring the Arctic
Read the Fine Print
Rating
0.0 stars

This lesson sequence guides students to learn about the geography and the unique characteristics of the Arctic, including vegetation, and people who live there. Students use Google Earth to explore the Arctic and learn about meteorological observations in the Arctic, including collecting their own data in hands-on experiments. This is the first part of a three-part curriculum about Arctic climate.

Subject:
Applied Science
Career and Technical Education
Environmental Science
Environmental Studies
Physical Science
Material Type:
Activity/Lab
Provider:
CLEAN: Climate Literacy and Energy Awareness Network
Provider Set:
CLEAN: Climate Literacy and Energy Awareness Network
Author:
Anne Gold
CIRES Education and Outreach; University of Colorado Boulder
Karin Kirk
Date Added:
09/24/2018
Arctic Climate Curriculum, Activity 2: Do you really want to visit the Arctic?
Read the Fine Print
Rating
0.0 stars

In this jigsaw activity, students explore meteorological data collected from Eureka, Canada to try to decide when would be the best time for an Arctic visit.

Subject:
Career and Technical Education
Environmental Studies
Physical Science
Material Type:
Activity/Lab
Provider:
CLEAN: Climate Literacy and Energy Awareness Network
Provider Set:
CLEAN: Climate Literacy and Energy Awareness Network
Author:
Anne Gold
CIRES Education and Outreach; University of Colorado Boulder
Karin Kirk
Date Added:
09/24/2018
Arctic Climate Curriculum, Activity 3: Exploring Arctic Climate Data
Read the Fine Print
Educational Use
Rating
0.0 stars

In this activity, students use authentic Arctic climate data to unravel some causes and effects related to the seasonal melting of the snowpack and to further understand albedo.

Subject:
Applied Science
Career and Technical Education
Environmental Science
Environmental Studies
Physical Science
Material Type:
Activity/Lab
Provider:
CLEAN: Climate Literacy and Energy Awareness Network
Provider Set:
CLEAN: Climate Literacy and Energy Awareness Network
Author:
Anne Gold
CIRES Education Outreach; University of Colorado Boulder
Karin Kirk
Date Added:
05/13/2015
Arctic Climate Feedbacks
Read the Fine Print
Rating
0.0 stars

This video uses film of the Arctic and Arctic researchers as well as animations to discuss feedbacks in the Arctic climate system related to sea ice, the ocean, and clouds. It explains concepts such as albedo and positive and negative feedbacks. The narrative includes discussion of current research and a summary which explains why understanding feedbacks is important.

Subject:
Applied Science
Career and Technical Education
Environmental Science
Environmental Studies
Oceanography
Physical Science
Provider:
CLEAN: Climate Literacy and Energy Awareness Network
Provider Set:
CLEAN: Climate Literacy and Energy Awareness Network
Author:
CIRES
Polar Bear Project
Date Added:
09/24/2018
Arctic Climate Perspectives
Unrestricted Use
CC BY
Rating
0.0 stars

This video, along with a background essay, focuses on impacts of climate change on the lives of Native Alaskans around Barrow, Alaska. Specific changes include the timing of the changes in the formation and breakout of sea ice and the impacts on subsistence living.

Subject:
Applied Science
Career and Technical Education
Environmental Science
Environmental Studies
Physical Science
Provider:
CLEAN: Climate Literacy and Energy Awareness Network
Provider Set:
CLEAN: Climate Literacy and Energy Awareness Network
Author:
U.S. Department of Energy, Office of Science, Atmospheric Radiation Measurement Program and WGBH
Date Added:
06/19/2012
The Arctic: Our First Sign of Climate Change
Read the Fine Print
Arctic Sea Ice Concentrations for September (Minimum)
Read the Fine Print
Rating
0.0 stars

This animation shows the Arctic sea ice September (minimum) extents from 1979-2016. Accessible from http://nsidc.org/cryosphere/sotc/sea_ice.html

Subject:
Applied Science
Career and Technical Education
Environmental Science
Environmental Studies
Oceanography
Physical Science
Provider:
CLEAN: Climate Literacy and Energy Awareness Network
Provider Set:
CLEAN: Climate Literacy and Energy Awareness Network
Author:
National Snow and Ice Data Center
Date Added:
09/24/2018
Arctic Sea Ice Is Losing Its Bulwark
Read the Fine Print
Rating
0.0 stars

This visualization shows static and animated images of changes in Arctic sea ice 1984-2016.

Subject:
Applied Science
Career and Technical Education
Environmental Science
Environmental Studies
Physical Science
Provider:
CLEAN: Climate Literacy and Energy Awareness Network
Provider Set:
CLEAN: Climate Literacy and Energy Awareness Network
Author:
Cindy Starr
NASA Scientific Visualization Studio.
Date Added:
09/24/2018
Arctic Tundra May Contribute to Warmer World
Read the Fine Print
Educational Use
Rating
0.0 stars

In this audio slideshow, an ecologist from the University of Florida describes the radiocarbon dating technique that scientists use to determine the amount of carbon within the permafrost of the Arctic tundra. Understanding the rate of carbon released as permafrost thaws is necessary to understand how this positive feedback mechanism is contributing to climate change that may further increase global surface temperatures.

Subject:
Applied Science
Career and Technical Education
Environmental Science
Environmental Studies
Physical Science
Material Type:
Diagram/Illustration
Reading
Provider:
CLEAN: Climate Literacy and Energy Awareness Network
Provider Set:
CLEAN: Climate Literacy and Energy Awareness Network
Author:
National Science Foundation
University of Florida
Date Added:
05/15/2012
Are Humans Influencing Modern Climate?
Read the Fine Print
Rating
0.0 stars

In this short video, host Dr. Ryan interviews graduate student Amy Steiker at the Institute of Arctic and Alpine Research about her research, using isotopes of nitrous oxide, connecting human activity to greenhouse gas emissions.

Subject:
Applied Science
Atmospheric Science
Career and Technical Education
Environmental Science
Environmental Studies
Physical Science
Provider:
CLEAN: Climate Literacy and Energy Awareness Network
Provider Set:
CLEAN: Climate Literacy and Energy Awareness Network
Author:
Ryan Vachon
University of Colorado Outreach
Date Added:
09/24/2018
Are You An Energy Efficient Consumer?
Read the Fine Print
Rating
0.0 stars

This activity engages students in learning about ways to become energy efficient consumers. Students examine how different countries and regions around the world use energy over time, as reflected in night light levels. They then track their own energy use, identify ways to reduce their individual energy consumption, and explore how community choices impact the carbon footprint.

Subject:
Geoscience
Physical Science
Material Type:
Activity/Lab
Provider:
CLEAN: Climate Literacy and Energy Awareness Network
Provider Set:
CLEAN: Climate Literacy and Energy Awareness Network
Author:
Marian Koshland Science Museum of the National Academy of Sciences
Date Added:
10/27/2014
As Permafrost Thaws, Scientists Study the Risks
Read the Fine Print
Educational Use
Rating
0.0 stars

This article and slide show from the New York Times, features several scientists from the University of Alaska, Fairbanks, who study the effects of thawing permafrost in Alaska.

Subject:
Applied Science
Biology
Career and Technical Education
Chemistry
Environmental Science
Environmental Studies
Geology
Life Science
Physical Science
Material Type:
Reading
Simulation
Provider:
CLEAN: Climate Literacy and Energy Awareness Network
Provider Set:
CLEAN: Climate Literacy and Energy Awareness Network
Author:
Josh Haner
New York Times
Date Added:
08/29/2012
Assess burn scars with satellite imagery
Read the Fine Print
Educational Use
Rating
0.0 stars

Using Landsat 8 imagery from before and after the 2015 wildfire season in Glacier National Park, Montana, learners calculate the damage using a Normalized Burn Index, digitize the burn area, and publish to ArcGIS Online.

Subject:
Applied Science
Atmospheric Science
Career and Technical Education
Ecology
Environmental Science
Environmental Studies
Life Science
Physical Science
Material Type:
Activity/Lab
Provider:
CLEAN: Climate Literacy and Energy Awareness Network
Provider Set:
CLEAN: Climate Literacy and Energy Awareness Network
Author:
ArcGIS
Date Added:
07/07/2021
Assessing Drought in the United States
Read the Fine Print
Educational Use
Rating
0.0 stars

This easy-to-understand video animation describes drought and explains the different categories of drought used by the drought monitor. It discusses the effects of and contributions to drought, what the implications of the different drought levels are, and puts the drought maps into context to understand how the impacts vary geographically (e.g. drought in Nevada vs Kansas - one could affect tourism, the other agriculture). It also touches on how the development of maps/drought severity is determined and how it might vary geographically. The animation provides a basic overview of statistics and percentiles and the concept of '100 year events.'

Subject:
Agriculture
Applied Science
Atmospheric Science
Career and Technical Education
Economics
Environmental Science
Environmental Studies
Physical Science
Social Science
Material Type:
Diagram/Illustration
Reading
Provider:
CLEAN: Climate Literacy and Energy Awareness Network
Provider Set:
CLEAN: Climate Literacy and Energy Awareness Network
Author:
CoCoRaHS
Colorado Climate Center
Date Added:
06/25/2019
Atlas of Change
Read the Fine Print
Rating
0.0 stars

In this activity, students explore the web-based U.S. Forest Service Climate Change Atlas to learn about projected climate changes in their state and how suitable habitat for tree and bird species is projected to change by 2100.

Subject:
Applied Science
Career and Technical Education
Ecology
Environmental Science
Environmental Studies
Life Science
Physical Science
Material Type:
Activity/Lab
Provider:
CLEAN: Climate Literacy and Energy Awareness Network
Provider Set:
CLEAN: Climate Literacy and Energy Awareness Network
Author:
PINEMAP Project
University of Florida, Project Learning Tree
Date Added:
09/24/2018
Atmospheric CO2 at Mauna Loa Observatory
Read the Fine Print
Rating
0.0 stars

These graphs show carbon dioxide measurements at the Mauna Loa Observatory, Hawaii. The graphs display recent measurements as well as historical long term measurements. The related website summarizes in graphs the recent monthly CO2, the full CO2 Record, the annual Mean CO2 Growth Rate, and gives links to detailed CO2 data for this location, which is one of the most important CO2 tracking sites in the world.

Subject:
Applied Science
Career and Technical Education
Environmental Science
Environmental Studies
Physical Science
Provider:
CLEAN: Climate Literacy and Energy Awareness Network
Provider Set:
CLEAN: Climate Literacy and Energy Awareness Network
Author:
NOAA
Date Added:
09/24/2018
Atmospheric Carbon: Can We Offset the Increase?
Read the Fine Print
Rating
0.0 stars

This is a multi-step activity that helps students measure, investigate, and understand the increase in atmospheric CO2 and the utility of carbon offsets. It also enables students to understand that carbon offsets, through reforestation, are not sufficient to balance increases in atmospheric C02 concentration.

Subject:
Atmospheric Science
Physical Science
Material Type:
Activity/Lab
Provider:
CLEAN: Climate Literacy and Energy Awareness Network
Provider Set:
CLEAN: Climate Literacy and Energy Awareness Network
Author:
Jocelyn Boucher
Maine Maritime Academy
On the Cutting Edge
Date Added:
09/24/2018
Atmospheric Processes
Read the Fine Print
Rating
0.0 stars

This image depicts a representative subset of the atmospheric processes related to aerosol lifecycles, cloud lifecycles, and aerosol-cloud-precipitation interactions that must be understood to improve future climate predictions.

Subject:
Physical Science
Provider:
CLEAN: Climate Literacy and Energy Awareness Network
Provider Set:
CLEAN: Climate Literacy and Energy Awareness Network
Author:
Climate Placemat: Energy-Climate Nexus
US Department of Energy
US Department of Energy Office of Science
Date Added:
10/27/2014
Atmospheric concentrations of carbon dioxide, methane and nitrous oxide
Unrestricted Use
CC BY
Rating
0.0 stars

This is a figure from the 2007 IPCC Assessment Report 4 on atmospheric concentrations of carbon dioxide, methane and nitrous oxide over the last 10,000 years (large panels) and since 1750 (inset panels).

Subject:
Physical Science
Material Type:
Diagram/Illustration
Provider:
CLEAN: Climate Literacy and Energy Awareness Network
Provider Set:
CLEAN: Climate Literacy and Energy Awareness Network
Author:
IPCC (Intergovernmental Panel of Climate Change)
Date Added:
06/19/2012