Students will brainstorm ways that they use and waste natural resources. Also, …
Students will brainstorm ways that they use and waste natural resources. Also, they will respond to some facts about population growth and how people use petroleum. Lastly, students will consider the different ways that engineers interact with and use our natural resources.
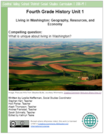
The unit is focused on the examination of geography in terms of …
The unit is focused on the examination of geography in terms of “place.” Students dive into inquiry to answer the compelling question, What is unique about living in Washington? Through this question students will understand where and why people live in Washington State. Students will dive into the regions of Washington State and define it through many characteristics. Students will ultimately choose a region to become an expert on and communicate what makes that region unique. Each student’s performance task product will reflect choice and build upon student strengths according to their skill set.
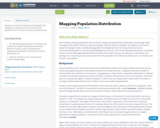
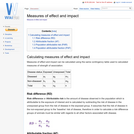
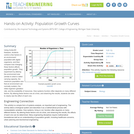
Population research is important to Geography. This assignment is designed to teach …
Population research is important to Geography. This assignment is designed to teach students about population and to translate that into a geospatial map.
This video examines the global perspective of materials. It looks that the …
This video examines the global perspective of materials. It looks that the difference between reserves and resources and considers the question of "running out" of materials.This video part of the Sustainability Learning Suites, made possible in part by a grant from the National Science Foundation. See 'Learn more about this resource' for Learning Objectives and Activities.
This video explains what is meant by a materials life cycle framework. …
This video explains what is meant by a materials life cycle framework. It describes what happens at each step in the life cycle and why designers should consider the life cycle in the design process. This video is part of the Sustainability Learning Suites, made possible in part by a grant from the National Science Foundation. See 'Learn more about this resource' for Learning Objectives and Activities.
This video examines the use of life cycle assessment methods as an …
This video examines the use of life cycle assessment methods as an aid to the design process. It introduces three methods: full life cycle assessment, streamlined life cycle assessment, and economic input-output life cycle assessment. The advantages and limits of each stated. This video is part of the Sustainability Learning Suites, made possible in part by a grant from the National Science Foundation. See 'Learn more about this resource' for Learning Objectives and Activities.
What can we learn from nature's designs for sustainability? This video compares …
What can we learn from nature's designs for sustainability? This video compares nature's methods with the industrial era methods of design. It recommends a design strategy based on the connection or relationship between things as a means to achieve transformative innovation for sustainability. This video is part of the Sustainability Learning Suites, made possible in part by a grant from the National Science Foundation. See 'Learn more about this resource' for Learning Objectives and Activities.
FOR STANDARD :- XI th.OBJECTIVES :Pupil recalls the meaning of population.Pupil memorizes …
FOR STANDARD :- XI th.OBJECTIVES :Pupil recalls the meaning of population.Pupil memorizes the definition of population.Pupil interprets the high birth rate and low death rate.Pupil analyzes the unfavourable sex ratio.Pupil identifies the reasons for growing population.Pupil identifies the social problems faced by the nation. DEFINITION OF POPULATION:ACCORDING TO PROF. HARRISON ," HUMAN RESOURCES CONSTITUTE THE ULTIMATE BASIS FOR THE WEALTH OF NATION".FEATURES OF POPULATION:Second largest populated country.Unfavourable sex ratio.High density of population.Changes in age composition.Birth rate and Death rate.Increasing life expectancy.
In this activity, students collect and analyze data adapted from recent research …
In this activity, students collect and analyze data adapted from recent research that explores the correlation between the presence of fish farms and mortality rates in wild salmon runs adjacent to the fish farms. Students then relate their findings to nearby populations of orcas to theorize how a decline in the wild salmon population could affect orca populations.
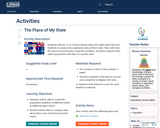
Students will use a U.S. Census Bureau data tool called State Facts …
Students will use a U.S. Census Bureau data tool called State Facts for Students to analyze the population data of their state. They will write the data in several forms, round the numbers, and then compare their state’s population with that of a nearby state.
This video looks at the global population and trends. It also explains …
This video looks at the global population and trends. It also explains the concept of carrying capacity and how a person's behavior influences carrying capacity. This video is part of the Sustainability Learning Suites, made possible in part by a grant from the National Science Foundation. See 'Learn more about this resource' for Learning Objectives and Activities.
This video describes the ecological footprint and its limitation. It goes into …
This video describes the ecological footprint and its limitation. It goes into some depth on the computation on the footprint and what it means for the global population. This video is part of the Sustainability Learning Suites, made possible in part by a grant from the National Science Foundation. See 'Learn more about this resource' for Learning Objectives and Activities.
Students learn about population density within environments and ecosystems. They determine the …
Students learn about population density within environments and ecosystems. They determine the density of a population and think about why population density and distribution information is useful to engineers for city planning and design as well as for resource allocation.
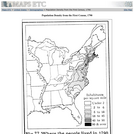
A map of the eastern United States in 1790 showing the western …
A map of the eastern United States in 1790 showing the western extent of the territories to the Mississippi, and the distribution of European–American population at the time. The map is keyed to show areas of population densities ranging from under 2 inhabitants per square mile to areas with 90 or more inhabitants per square mile.
Using Avida-ED freeware, students control a few factors in an environment populated …
Using Avida-ED freeware, students control a few factors in an environment populated with digital organisms, and then compare how changing these factors affects population growth. They experiment by altering the environment size (similar to what is called carrying capacity, the maximum population size that an environment can normally sustain), the initial organism gestation rate, and the availability of resources. How systems function often depends on many different factors. By altering these factors one at a time, and observing the results, students are able to clearly see the effect of each one.
In this activity, students will refer to the 1790 and 1800 Censuses …
In this activity, students will refer to the 1790 and 1800 Censuses to compare the total population with the population of enslaved people, drawing conclusions from the data.
No restrictions on your remixing, redistributing, or making derivative works. Give credit to the author, as required.
Your remixing, redistributing, or making derivatives works comes with some restrictions, including how it is shared.
Your redistributing comes with some restrictions. Do not remix or make derivative works.
Most restrictive license type. Prohibits most uses, sharing, and any changes.
Copyrighted materials, available under Fair Use and the TEACH Act for US-based educators, or other custom arrangements. Go to the resource provider to see their individual restrictions.