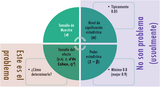
Esta guía práctica acompaña la serie de videos Poder estadístico y tamaño …
Esta guía práctica acompaña la serie de videos Poder estadístico y tamaño de muestra en R, de mi canal de YouTube Investigación Abierta, que recomiendo ver antes de leer este documento. Contiene una explicación general del análisis de poder estadístico y cálculo de tamaño de muestra, centrándose en el procedimiento para realizar análisis de poder y tamaños de muestra en jamovi y particularmente en R, usando los paquetes pwr (para diseños sencillos) y Superpower (para diseños factoriales más complejos). La sección dedicada a pwr está ampliamente basada en este video de Daniel S. Quintana (2019).
In this problem set students are given Rb/Sr and 87Sr/86Sr data for …
In this problem set students are given Rb/Sr and 87Sr/86Sr data for whole rock and mineral samples from three granitic intrusions in the Sierra Nevada. They use these data (in EXCEL) to calculate isochron ages and initial ages for the intrusions and then interpret their results. This problem is intended to teach some spreadsheet skills (linear regressions, graphing) as well as having them think about the use of radiogenic isotopes.
(Note: this resource was added to OER Commons as part of a batch upload of over 2,200 records. If you notice an issue with the quality of the metadata, please let us know by using the 'report' button and we will flag it for consideration.)
This lab exercise provides students with activities utilizing vector operations within the …
This lab exercise provides students with activities utilizing vector operations within the context of the atmospheric and oceanic environments.
(Note: this resource was added to OER Commons as part of a batch upload of over 2,200 records. If you notice an issue with the quality of the metadata, please let us know by using the 'report' button and we will flag it for consideration.)
This course covers empirical strategies for applied micro research questions. Our agenda …
This course covers empirical strategies for applied micro research questions. Our agenda includes regression and matching, instrumental variables, differences-in-differences, regression discontinuity designs, standard errors, and a module consisting of 8–9 lectures on the analysis of high-dimensional data sets a.k.a. "Big Data".
Applied Mathematics, Third Edition. This textbook was written for the math component …
Applied Mathematics, Third Edition. This textbook was written for the math component for Associate of Applied Science degrees at the College of Southern Nevada.
6.728 is offered under the department's "Devices, Circuits, and Systems" concentration. The …
6.728 is offered under the department's "Devices, Circuits, and Systems" concentration. The course covers concepts in elementary quantum mechanics and statistical physics, introduces applied quantum physics, and emphasizes an experimental basis for quantum mechanics. Concepts covered include: Schrodinger's equation applied to the free particle, tunneling, the harmonic oscillator, and hydrogen atom, variational methods, Fermi-Dirac, Bose-Einstein, and Boltzmann distribution functions, and simple models for metals, semiconductors, and devices such as electron microscopes, scanning tunneling microscope, thermonic emitters, atomic force microscope, and others.
I designed the course for graduate students who use statistics in their …
I designed the course for graduate students who use statistics in their research, plan to use statistics, or need to interpret statistical analyses performed by others. The primary audience are graduate students in the environmental sciences, but the course should benefit just about anyone who is in graduate school in the natural sciences. The course is not designed for those who want a simple overview of statistics; well learn by analyzing real data. This course or equivalent is required for UMB Biology and EEOS Ph.D. students. It is a recommended course for several of the intercampus graduate school of marine science program options.
The primary learning objective of this textbook is to introduce the reader …
The primary learning objective of this textbook is to introduce the reader to the fundamental statistical methods and basic analytical procedures associated with processing data in regard to healthcare research. It is intended that by working through the applications and practice problems, readers should be able to understand and apply some of the methods for developing, implementing, and applying healthcare statistic principles in research.
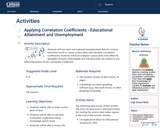
Students will use state and regional unemployment data for various education levels …
Students will use state and regional unemployment data for various education levels to create scatter plots and calculate correlation coefficients. Students will then compare scatter plots with different strengths of linear relationships and will determine the impact of any influential points on the correlation coefficient.
Measuring the dimensions of nano-circuits requires an expensive, high-resolution microscope with integrated …
Measuring the dimensions of nano-circuits requires an expensive, high-resolution microscope with integrated video camera and a computer with sophisticated imaging software, but in this activity, students measure nano-circuits using a typical classroom computer and (the free-to-download) GeoGebra geometry software. Inserting (provided) circuit pictures from a high-resolution microscope as backgrounds in GeoGebra's graphing window, students use the application's tools to measure lengths and widths of circuit elements. To simplify the conversion from the on-screen units to the real circuits' units and the manipulation of the pictures, a GeoGebra measuring interface is provided. Students export their data from GeoGebra to Microsoft® Excel® for graphing and analysis. They test the statistical significance of the difference in circuit dimensions, as well as obtain a correlation between average changes in original vs. printed circuits' widths. This activity and its associated lesson are suitable for use during the last six weeks of the AP Statistics course; see the topics and timing note below for details.
Student teams investigate Arctic Sea Ice by analyzing actual data and making …
Student teams investigate Arctic Sea Ice by analyzing actual data and making predictions. A worthwhile extension is to predict the first year that the Arctic Ocean will be ice free.
(Note: this resource was added to OER Commons as part of a batch upload of over 2,200 records. If you notice an issue with the quality of the metadata, please let us know by using the 'report' button and we will flag it for consideration.)
This learning video deals with a question of geometrical probability. A key …
This learning video deals with a question of geometrical probability. A key idea presented is the fact that a linear equation in three dimensions produces a plane. The video focuses on random triangles that are defined by their three respective angles. These angles are chosen randomly subject to a constraint that they must sum to 180 degrees. An example of the types of in-class activities for between segments of the video is: Ask six students for numbers and make those numbers the coordinates x,y of three points. Then have the class try to figure out how to decide if the triangle with those corners is acute or obtuse.
"The Art of the Probable" addresses the history of scientific ideas, in …
"The Art of the Probable" addresses the history of scientific ideas, in particular the emergence and development of mathematical probability. But it is neither meant to be a history of the exact sciences per se nor an annex to, say, the Course 6 curriculum in probability and statistics. Rather, our objective is to focus on the formal, thematic, and rhetorical features that imaginative literature shares with texts in the history of probability. These shared issues include (but are not limited to): the attempt to quantify or otherwise explain the presence of chance, risk, and contingency in everyday life; the deduction of causes for phenomena that are knowable only in their effects; and, above all, the question of what it means to think and act rationally in an uncertain world. Our course therefore aims to broaden students' appreciation for and understanding of how literature interacts with – both reflecting upon and contributing to – the scientific understanding of the world. We are just as centrally committed to encouraging students to regard imaginative literature as a unique contribution to knowledge in its own right, and to see literary works of art as objects that demand and richly repay close critical analysis. It is our hope that the course will serve students well if they elect to pursue further work in Literature or other discipline in SHASS, and also enrich or complement their understanding of probability and statistics in other scientific and engineering subjects they elect to take.
This module introduces students who are already familiar with GIS to doing …
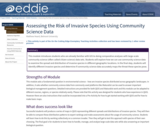
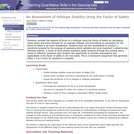
This module introduces students who are already familiar with GIS to doing comparative analyses with large-scale community science (often called citizen science) data sets. Students will explore how we can use community science data to examine the spread and distribution of invasive species in different geographic locations. In the final step, students will identify different invasive species and determine if community science data accurately maps the threat these species pose.
(Note: this resource was added to OER Commons as part of a batch upload of over 2,200 records. If you notice an issue with the quality of the metadata, please let us know by using the 'report' button and we will flag it for consideration.)
Instruction on use of Fisher statistics to determine the mean and 95% …
Instruction on use of Fisher statistics to determine the mean and 95% confidence interval of geological vectors, lines or planes, with examples, problems and an Excel spreadsheet for computation.
(Note: this resource was added to OER Commons as part of a batch upload of over 2,200 records. If you notice an issue with the quality of the metadata, please let us know by using the 'report' button and we will flag it for consideration.)
In this homework assignment students are asked to consider the balance of …
In this homework assignment students are asked to consider the balance of forces on a hill slope using the Factor of Safety.
(Note: this resource was added to OER Commons as part of a batch upload of over 2,200 records. If you notice an issue with the quality of the metadata, please let us know by using the 'report' button and we will flag it for consideration.)
Modeling traffic data is important for urban planning, creating transportation systems, and …
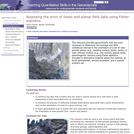
Modeling traffic data is important for urban planning, creating transportation systems, and even predicting how much foot traffic a retail store can expect in a given day. This genre of dynamic data science activities could be classified as “finding a needle in a haystack,” giving students a chance to mine big data to make insights about traffic use.
According to the Bay Area Rapid Transit District, about 400,000 people used the BART system daily in 2018. In BARTy, students investigate BART data from 2015 to learn about passenger use and explore traffic patterns. The Teacher Guide includes a game-like investigation to locate a “mystery meeting,” and suggests ways to help students figure out peak passenger use, popular stations, and the impact of events in San Francisco on BART usage.
This document includes two activities related to earthquake base isolation. Learners explore …
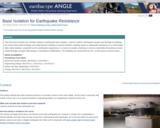
This document includes two activities related to earthquake base isolation. Learners explore earthquake hazards and damage to buildings by constructing model buildings and subjecting the buildings to ground vibration (shaking similar to earthquake vibrations) on a small shake table. Base isolation a powerful tool for earthquake engineering. It is meant to enable a building to survive a potentially devastating seismic impact through a proper initial design or subsequent modifications. The buildings are constructed by two- or three-person learner teams.
(Note: this resource was added to OER Commons as part of a batch upload of over 2,200 records. If you notice an issue with the quality of the metadata, please let us know by using the 'report' button and we will flag it for consideration.)
In Basic Engineering Data Collection and Analysis, Stephen B. Vardeman and J. …
In Basic Engineering Data Collection and Analysis, Stephen B. Vardeman and J. Marcus Jobe stress the practical over the theoretical. Step by step, students get real engineering data and scenario examples along with chapter-long case studies that illustrate concepts in realistic, thoroughly detailed situations. This approach encourages students to work through the material by carrying out data collection and analysis projects from problem formulation through the preparation of professional technical reports—just as if they were on the job.
Short Description: This book provides a brief introduction to some common ideas …
Short Description: This book provides a brief introduction to some common ideas in the study of probability. At the University of Minnesota, this material is included in a course on College Algebra designed to give students the basic skills to take an introductory Statistics course. The material itself is basic, and should be within the grasp of students who have successfully completed a high school Algebra I course.
Word Count: 1827
ISBN: 978-1-946135-79-7
(Note: This resource's metadata has been created automatically by reformatting and/or combining the information that the author initially provided as part of a bulk import process.)
No restrictions on your remixing, redistributing, or making derivative works. Give credit to the author, as required.
Your remixing, redistributing, or making derivatives works comes with some restrictions, including how it is shared.
Your redistributing comes with some restrictions. Do not remix or make derivative works.
Most restrictive license type. Prohibits most uses, sharing, and any changes.
Copyrighted materials, available under Fair Use and the TEACH Act for US-based educators, or other custom arrangements. Go to the resource provider to see their individual restrictions.