This activity is an advanced version of the “Keep your eyes on …
This activity is an advanced version of the “Keep your eyes on the ball” activity by Bereska, et al. (1999). Students should gain experience with differentiating between independent and dependent variables, using linear regression to describe the relationship between these variables, and drawing inference about the parameters of the population regression line. Each group of students collects data on the rebound heights of a ball dropped multiple times from each of several different heights. By plotting the data, students quickly recognize the linear relationship. After obtaining the least squares estimate of the population regression line, students can set confidence intervals or test hypotheses on the parameters. Predictions of rebound length can be made for new values of the drop height as well. Data from different groups can be used to test for equality of the intercepts and slopes. By focusing on a particular drop height and multiple types of balls, one can also introduce the concept of analysis of variance.
In these activities designed to introduce sampling distributions and the Central Limit …
In these activities designed to introduce sampling distributions and the Central Limit Theorem, students generate several small samples and note patterns in the distributions of the means and proportions that they themselves calculate from these samples.
This group activity illustrates the concepts of size and power of a …
This group activity illustrates the concepts of size and power of a test through simulation. Students simulate binomial data by repeatedly rolling a ten-sided die, and they use their simulated data to estimate the size of a binomial test.
An important objective in hiring is to ensure diversity in the workforce. …
An important objective in hiring is to ensure diversity in the workforce. The race or gender of individuals hired by an organization should reflect the race or gender of the applicant pool. If certain groups are under-represented or over-represented among the employees, then there may be a case for discrimination in hiring. On the other hand, there may be a number of random factors unrelated to discrimination, such as the timing of the interview or competition from other employers, that might cause one group to be over-represented or under-represented. In this exercise, we ask students to investigate the role of randomness in hiring, and to consider how this might be used to help substantiate or refute charges of discrimination.
The activity is designed to help students develop a better intuitive understanding …
The activity is designed to help students develop a better intuitive understanding of what is meant by variability in statistics. Emphasis is placed on the standard deviation as a measure of variability. As they learn about the standard deviation, many students focus on the variability of bar heights in a histogram when asked to compare the variability of two distributions. For these students, variability refers to the variation in bar heights. Other students may focus only on the range of values, or the number of bars in a histogram, and conclude that two distributions are identical in variability even when it is clearly not the case. This activity can help students discover that the standard deviation is a measure of the density of values about the mean of a distribution and to become more aware of how clusters, gaps, and extreme values affect the standard deviation.
The Food and Drug Administration requires pharmaceutical companies to establish a shelf …
The Food and Drug Administration requires pharmaceutical companies to establish a shelf life for all new drug products through a stability analysis. This is done to ensure the quality of the drug taken by an individual is within established levels. The purpose of this out-of-class project or in-class example is to determine the shelf life of a new drug. This is done through using simple linear regression models and correctly interpreting confidence and prediction intervals. An Excel spreadsheet and SAS program are given to help perform the analysis.
This article describes an interactive activity illustrating general properties of hypothesis testing …
This article describes an interactive activity illustrating general properties of hypothesis testing and hypothesis tests for proportions. Students generate, collect, and analyze data. Through simulation, students explore hypothesis testing concepts. Concepts illustrated are: interpretation of p-values, type I error rate, type II error rate, power, and the relationship between type I and type II error rates and power. This activity is appropriate for use in an introductory college or high school statistics course.
This group activity focuses on conducting an experiment to determine which of …
This group activity focuses on conducting an experiment to determine which of two brands of paper towels are more absorbent by measuring the amount of water absorbed. A two-sample t-test can be used to analyze the data, or simple graphics and descriptive statistics can be used as an exploratory analysis. Students are asked to think about design issues, and to write a short report stating their results and conclusions, along with an evaluation of the experimental design.
Christopher J. Malone, Christopher R. Bilder, Deborah J. Rumsey, John E. Boyer, Kansas State University, Ohio State University, Oklahoma State University
This applet allows the user to adjust the degrees of freedom of …
This applet allows the user to adjust the degrees of freedom of the T Distribution with a slider or manual input. The applet allows the user to fix the x and or y axes. The user immediately sees how this affects the shape of the graph.
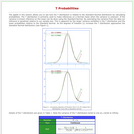
The applet in this section allows you to see how the T …
The applet in this section allows you to see how the T distribution is related to the Standard Normal distribution by calculating probabilities. The T distribution is primarily used to make inferences on a Normal mean when the variance is unknown.
This applet allows the user to adjust the alpha (rate) and the …
This applet allows the user to adjust the alpha (rate) and the beta (scale) parameters of the Gamma distribution with a slider or manual input. The user can also indicate a model (density, hazard, or reliability).
No restrictions on your remixing, redistributing, or making derivative works. Give credit to the author, as required.
Your remixing, redistributing, or making derivatives works comes with some restrictions, including how it is shared.
Your redistributing comes with some restrictions. Do not remix or make derivative works.
Most restrictive license type. Prohibits most uses, sharing, and any changes.
Copyrighted materials, available under Fair Use and the TEACH Act for US-based educators, or other custom arrangements. Go to the resource provider to see their individual restrictions.