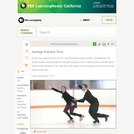
Beginning econometrics students often have an uneven preparation in statistics. The simulation …
Beginning econometrics students often have an uneven preparation in statistics. The simulation gives students a clearer understanding of the behavior of OLS estimators.
Bayesian hypothesis testing presents an attractive alternative to p value hypothesis testing. …
Bayesian hypothesis testing presents an attractive alternative to p value hypothesis testing. Part I of this series outlined several advantages of Bayesian hypothesis testing, including the ability to quantify evidence and the ability to monitor and update this evidence as data come in, without the need to know the intention with which the data were collected. Despite these and other practical advantages, Bayesian hypothesis tests are still reported relatively rarely. An important impediment to the widespread adoption of Bayesian tests is arguably the lack of user-friendly software for the run-of-the-mill statistical problems that confront psychologists for the analysis of almost every experiment: the t-test, ANOVA, correlation, regression, and contingency tables. In Part II of this series we introduce JASP (http://www.jasp-stats.org), an open-source, cross-platform, user-friendly graphical software package that allows users to carry out Bayesian hypothesis tests for standard statistical problems. JASP is based in part on the Bayesian analyses implemented in Morey and Rouder’s BayesFactor package for R. Armed with JASP, the practical advantages of Bayesian hypothesis testing are only a mouse click away.
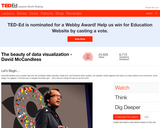
David McCandless turns complex data sets (like worldwide military spending, media buzz, …
David McCandless turns complex data sets (like worldwide military spending, media buzz, Facebook status updates) into beautiful, simple diagrams that tease out unseen patterns and connections. Good design, he suggests, is the best way to navigate information glut -- and it may just change the way we see the world. A quiz, thought provoking question, and links for further study are provided to create a lesson around the 18-minute video. Educators may use the platform to easily "Flip" or create their own lesson for use with their students of any age or level.
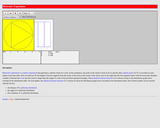
This resource consists of a Java applet and expository text. The applet …
This resource consists of a Java applet and expository text. The applet is a simulation of Bertrand's experiment: a random chord on a circle The event of interest is whether the length of the chord is larger than the length of the inscribed equilateral triangle. Three models for generating the random chord can be used.
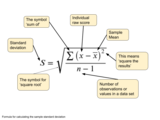
Outliers may not be the result of actual observations, but rather the …
Outliers may not be the result of actual observations, but rather the result of errors in data collection, data recording, or other parts of the data life cycle. This can be used to identify outliers for closer examination.
Students act as R&D entrepreneurs, learning ways to research variables affecting the …
Students act as R&D entrepreneurs, learning ways to research variables affecting the market of their proposed (hypothetical) products. They learn how to obtain numeric data using a variety of Internet tools and resources, sort and analyze the data using Excel and other software, and discover patterns and relationships that influence and guide decisions related to launching their products. First, student pairs research and collect pertinent consumer data, importing the data into spreadsheets. Then they clean, organize, chart and analyze the data to inform their product production and marketing plans. They calculate related statistics and gain proficiency in obtaining and finding relationships between variables, which is important in the work of engineers as well as for general technical literacy and decision-making. They summarize their work by suggesting product launch strategies and reporting their findings and conclusions in class presentations. A finding data tips handout, project/presentation grading rubric and alternative self-guided activity worksheet are provided. This activity is ideal for a high school statistics class.
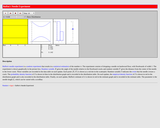
This resource consists of a Java applet and expository text. The applet …
This resource consists of a Java applet and expository text. The applet simulates Buffon's needle experiment and the corresponding approximation of pi. The event of interest is that the needle crosses a crack. The length of the needle can be varied. The applet illustrates a random experiment, the sample space, random variables, probability, and relative frequency.
There is growing body of evidence to support that students who directly …
There is growing body of evidence to support that students who directly experience authentic scientific research are more likely to continue onto advanced degrees and careers in Science, Technology, Engineering and Mathematics (STEM). In an effort to introduce more students to the benefits of scientific research we have drawn on an ongoing research project aimed at understanding how Corals Respond to the Environment (CRE) to develop an interdisciplinary laboratory course based on Authentic Research Experiences (ARE). A small cohort of undergraduate students enrolled in a semester-long course, entitled CREARE, perform biochemical experiments in the laboratory, analyze environmental data by R statistical software and prepared a report modeled after a research manuscript to present their work. The impact of CREARE on student learning gains and attitudes towards science is being measured, as is the impact of CREARE on participants' career choices and retention in STEM. This multidisciplinary research program addresses the impact of climate change on the health of a critically endangered coral species, ultimately leading to a better stewardship of this invaluable resource. Furthermore, CREARE offers a unique experience for students, one that may serve as a model for the development of more research-based courses, leading to improved retention in our STEM departments.
(Note: this resource was added to OER Commons as part of a batch upload of over 2,200 records. If you notice an issue with the quality of the metadata, please let us know by using the 'report' button and we will flag it for consideration.)
This resource consists of a Java applet and expository text. The applet …
This resource consists of a Java applet and expository text. The applet is a simulation of the experiment that consists of tossing a coin and then rolling either a red die or a green die, depending on the outcome of the coin toss. The probability of heads and the distributions of the two dice can be specified. The applet illustrates a two-stage experiment.
The Coke vs. Pepsi Taste Test Challenge has students design and carry …
The Coke vs. Pepsi Taste Test Challenge has students design and carry out an experiment to determine whether or not students are able to correctly identify two brands of cola in a blind taste test.In the first stage of the activity students design and conduct the experiment. In the second part of the activity students use Sampling SIM software (freely downloadable from http://www.tc.umn.edu/~delma001/stat_tools/) to simulate and gather information on what would be expected under chance conditions (i.e., if students obtained correct answers only by guessing). The students then compare the observed results to the chance results and make an inference about whether a given student can in fact correctly identify Coke and Pepsi in a blind taste test. Finally, the experiment is critiqued in terms of how well it met the standards for a good experiment.
This activity allows students to gain a better understanding of the experimental process and causality through considering control, random assignment, and possible confounding variables. The activity also allows students to begin to understand the process of hypothesis testing by comparing their observed results of the taste test to the results obtained through Sampling SIM (which model would be obtained by chance). Students make an inference about whether particular students in their class can truly tell the difference between Coke and Pepsi by reasoning about how surprising the observed results are compared to the simulated distribution of correct identifications by guessing. The activity also provides an opportunity for discussing generalizability to a population.
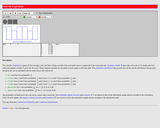
CODAP (Common Online Data Analysis Platform) is an easy to use data …
CODAP (Common Online Data Analysis Platform) is an easy to use data analysis environment that can be used in a wide variety of educational settings. CODAP is designed for grades 5 through 14, and aimed at teachers and curriculum developers. CODAP can be used across the curriculum to help students summarize, visualize, and interpret data, Conadvancing their skills to use data as evidence to support a claim.
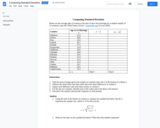
Communicating With Data has a distinctive structure and content, combining fundamental quantitative …
Communicating With Data has a distinctive structure and content, combining fundamental quantitative techniques of using data to make informed management decisions with illustrations of how real decision makers, even highly trained professionals, fall prey to errors and biases in their understanding. We present the fundamental concepts underlying the quantitative techniques as a way of thinking, not just a way of calculating, in order to enhance decision-making skills. Rather than survey all of the techniques of management science, we stress those fundamental concepts and tools that we believe are most important for the practical analysis of management decisions, presenting the material as much as possible in the context of realistic business situations from a variety of settings. Exercises and examples drawn from marketing, finance, operations management, strategy, and other management functions.
In this model eliciting activity (MEA), students are hired by a travel …
In this model eliciting activity (MEA), students are hired by a travel magazine to determine if two airlines that fly into Chicago are equally reliable. They examine data of flight arrival delay times for both airlines flying out of the same city. They first identify measures that can be used to compare the two airlines. Working in small groups, the students decide the size of a meaningful difference between the airlines for each measure and use that information to determine a rule that for deciding if one airline is more reliable than another. The students apply their rule to flight arrival delay data for the two airlines from four additional departure cities, and use the results to write a report to the magazine editor on whether or not one airline is more reliable than the other. This activity can serve as an introduction to ideas of central tendency and variability, and prepares students for formal approaches to comparing groups.
This course covers the algorithmic and machine learning foundations of computational biology …
This course covers the algorithmic and machine learning foundations of computational biology combining theory with practice. We cover both foundational topics in computational biology, and current research frontiers. We study fundamental techniques, recent advances in the field, and work directly with current large-scale biological datasets.
With the growing availability and lowering costs of genotyping and personal genome …
With the growing availability and lowering costs of genotyping and personal genome sequencing, the focus has shifted from the ability to obtain the sequence to the ability to make sense of the resulting information. This course is aimed at exploring the computational challenges associated with interpreting how sequence differences between individuals lead to phenotypic differences in gene expression, disease predisposition, or response to treatment.
This subject is a computer-oriented introduction to probability and data analysis. It …
This subject is a computer-oriented introduction to probability and data analysis. It is designed to give students the knowledge and practical experience they need to interpret lab and field data. Basic probability concepts are introduced at the outset because they provide a systematic way to describe uncertainty. They form the basis for the analysis of quantitative data in science and engineering. The MATLAB® programming language is used to perform virtual experiments and to analyze real-world data sets, many downloaded from the web. Programming applications include display and assessment of data sets, investigation of hypotheses, and identification of possible casual relationships between variables. This is the first semester that two courses, Computing and Data Analysis for Environmental Applications (1.017) and Uncertainty in Engineering (1.010), are being jointly offered and taught as a single course.
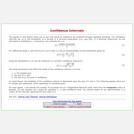
The applets in this section of Statistical Java allow you to see …
The applets in this section of Statistical Java allow you to see how levels of confidence are achieved through repeated sampling. The confidence intervals are related to the probability of successes in a Binomial experiment.
No restrictions on your remixing, redistributing, or making derivative works. Give credit to the author, as required.
Your remixing, redistributing, or making derivatives works comes with some restrictions, including how it is shared.
Your redistributing comes with some restrictions. Do not remix or make derivative works.
Most restrictive license type. Prohibits most uses, sharing, and any changes.
Copyrighted materials, available under Fair Use and the TEACH Act for US-based educators, or other custom arrangements. Go to the resource provider to see their individual restrictions.