As taught Spring Semester 2011. The objective of this module is to …
As taught Spring Semester 2011.
The objective of this module is to introduce students to the practice of quantitative data analysis in the social sciences. The lecture component of the module will explore a variety of the most commonly used statistical methods; in the laboratory component, students will learn to apply these techniques to the analysis of social science data. Through assignments, students will have the opportunity to develop and test their own hypotheses and explanations on major research data sets. The module should provide a sound grasp of the possibilities, methods, and dangers inherent in quantitative social and political research.
Module Codes: M14121 (20 credits)
Suitable for study at: Postgraduate Level
Dr Mark Pickup, School of Politics and International Relations
Dr Mark Pickup is a specialist in Comparative politics, with a particular interest in public opinion and democratic representation within North American and European countries. His research focuses on political information, public opinion, the media, election campaigns and electoral institutions.
Dr Pickup is also a Visiting Fellow in the Department of Politics at the University of Oxford, where he runs the Oxford Polling Observatory website
By the end of this section, you will be able to:Explain what …
By the end of this section, you will be able to:Explain what a correlation coefficient tells us about the relationship between variablesRecognize that correlation does not indicate a cause-and-effect relationship between variablesDiscuss our tendency to look for relationships between variables that do not really existRecognize how correlations coefficients tell us about the relationships between variables specific to selection methods.
Students are introduced to the technology of flexible circuits, some applications and …
Students are introduced to the technology of flexible circuits, some applications and the photolithography fabrication process. They are challenged to determine if the fabrication process results in a change in the circuit dimensions since, as circuits get smaller and smaller (nano-circuits), this could become very problematic. The lesson prepares students to conduct the associated activity in which they perform statistical analysis (using Excel® and GeoGebra) to determine if the circuit dimension sizes before and after fabrication are in fact statistically different. A PowerPoint® presentation and post-quiz are provided. This lesson and its associated activity are suitable for use during the last six weeks of the AP Statistics course; see the topics and timing note for details.
Students apply pre-requisite statistics knowledge and concepts learned in an associated lesson …
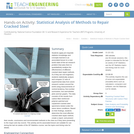
Students apply pre-requisite statistics knowledge and concepts learned in an associated lesson to a real-world state-of-the-art research problem that asks them to quantitatively analyze the effectiveness of different cracked steel repair methods. As if they are civil engineers, students statistically analyze and compare 12 sets of experimental data from seven research centers around the world using measurements of central tendency, five-number summaries, box-and-whisker plots and bar graphs. The data consists of the results from carbon-fiber-reinforced polymer patched and unpatched cracked steel specimens tested under the same stress conditions. Based on their findings, students determine the most effective cracked steel repair method, create a report, and present their results, conclusions and recommended methods to the class as if they were presenting to the mayor and city council. This activity and its associated lesson are suitable for use during the last six weeks of the AP Statistics course; see the topics and timing note for details.
Working as if they are engineers aiming to analyze and then improve …
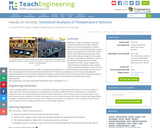
Working as if they are engineers aiming to analyze and then improve data collection devices for precision agriculture, students determine how accurate temperature sensors are by comparing them to each other. Teams record soil temperature data during a class period while making changes to the samples to mimic real-world crop conditions—such as the addition of water and heat and the removal of the heat. Groups analyze their collected data by finding the mean, median, mode, and standard deviation. Then, the class combines all the team data points in order to compare data collected from numerous devices and analyze the accuracy of their recording devices by finding the standard deviation of temperature readings at each minute. By averaging the standard deviations of each minute’s temperature reading, students determine the accuracy of their temperature sensors. Students present their findings and conclusions, including making recommendations for temperature sensor improvements.
I have designed and presented the content within StatsforMedics specifically for use …
I have designed and presented the content within StatsforMedics specifically for use by undergraduate medical students who are considering use of statistics for short-term research projects. However, this is with the understanding that students from allied health sciences may also benefit from engaging with the site and its sister site, Statistics CALs. Also, I am currently exploring use of selected content for outreach work in pre-university sectors.
The disciplines of music history and music theory have been slow to …
The disciplines of music history and music theory have been slow to embrace the digital revolutions that have transformed other fields' text-based scholarship (history and literature in particular). Computational musicology opens the door to the possibility of understanding—even if at a broad level—trends and norms of behavior of large repertories of music. This class presents the major approaches, results, and challenges of computational musicology through readings in the field, gaining familiarity with datasets, and hands on workshops and assignments on data analysis and "corpus" (i.e., repertory) studies. Class sessions alternate between discussion/lecture and labs on digital tools for studying music. A background in music theory and/or history is required, and experience in computer programming will be extremely helpful. Coursework culminates in an independent research project in quantitative or computational musicology that will be presented to the class as a whole.
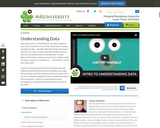
Data is all around us. Everything from the fitness tracker on your …
Data is all around us. Everything from the fitness tracker on your wrist to researchers at your local university are creating mountains of data big data. What does all this data mean? And how can it help us answer important questions such as: What are the leading causes of heart disease? Or what patterns are related to higher pay at your job? Looking at data can help us answer fun questions too whos likely to win the next Super Bowl? Leave the boring lectures behind and intuitively learn data analysis through interactive exercises that allow you to play with fascinating real-world datasets. By the end of this course, youll be comfortable applying the basics of statistical analysis and econometrics. There are no prerequisites and we encourage you to repeat the interactive lessons as often as you need.
No restrictions on your remixing, redistributing, or making derivative works. Give credit to the author, as required.
Your remixing, redistributing, or making derivatives works comes with some restrictions, including how it is shared.
Your redistributing comes with some restrictions. Do not remix or make derivative works.
Most restrictive license type. Prohibits most uses, sharing, and any changes.
Copyrighted materials, available under Fair Use and the TEACH Act for US-based educators, or other custom arrangements. Go to the resource provider to see their individual restrictions.