Geographic Information System (GIS) software manages data that represent the location of …
Geographic Information System (GIS) software manages data that represent the location of features (geographic coordinate data) and what they are like (attribute data); it also provides the ability to query, manipulate, and analyze those data. Because GIS allows one to represent social and environmental data on maps, it is a powerful tool for analysis and planning in various fields. This course is meant to introduce students to the basic capabilities of GIS.
In this activity, students familiarise themselves with the concept of a map …
In this activity, students familiarise themselves with the concept of a map by observing and describing maps, and drawing a map from an aerial photograph. They understand that any location on Earth is described by two numbers, latitude and longitude. The notion of scale and ratio is also explored.
In the Mapping Earthquakes to Save the World activity, students leverage real-time …
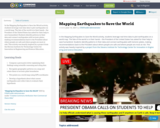
In the Mapping Earthquakes to Save the World activity, students leverage real-time data to plot earthquakes on a world map. The fate of the world is in their hands – the President of the United States has asked for their help to save humankind. Students identify patterns in their data and connect earthquakes with tectonic plates, making recommendations back to the President about where people are safe and where people are most at risk. This activity was heavily inspired by a project from the Stevens Institute for Technology Center for Innovation in Engineering and Science Education.
In the Mapping Earthquakes to Save the World activity, students leverage real-time …
In the Mapping Earthquakes to Save the World activity, students leverage real-time data to plot earthquakes on a world map. The fate of the world is in their hands – the President of the United States has asked for their help to save humankind. Students identify patterns in their data and connect earthquakes with tectonic plates, making recommendations back to the President about where people are safe and where people are most at risk. This activity was heavily inspired by a project from the Stevens Institute for Technology Center for Innovation in Engineering and Science Education.
Mapping Inequality opens the HOLC files at the National Archives to scholars, …
Mapping Inequality opens the HOLC files at the National Archives to scholars, students, and residents and policy leaders in local communities. This site makes the well-known security maps of HOLC available in digital form, as well as the data and textual assessments of the area descriptions that were created to go with the maps. By bringing study of HOLC into the digital realm, Mapping Inequality embraces a big data approach that can simultaneously give a national view of the program or a neighborhood-level assessment of the 1930s real estate rescue. Project researchers are providing access to some of the digital tools and interactive resources they are using in their own research, in the hope that the public will be able to understand the effects of federal housing policy and local implementation in their own communities.
This book is about how to read, use, and create maps. Our …
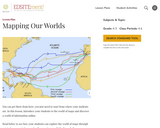
This book is about how to read, use, and create maps. Our exploration of maps will be informed by a contextual understanding of how maps reflect the relationship between society and technology, and how mapping is an essential form of scientific and artistic inquiry. We will also explore how mapping is used to address a variety of societal issues, such as land use planning and political gerrymandering. You will gain insight into the technical underpinnings of mapping as a science approach, complement on-going interest and activities, or provide an applied focus for research or policy.
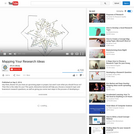
This quick, interactive tutorial will help students develop a general topic or …
This quick, interactive tutorial will help students develop a general topic or idea into a set of exploratory research questions, as well as giving them some next steps in the process of developing a research question. Make sure there is a blank sheet of paper and a pen or pencil handy, and let's get started!
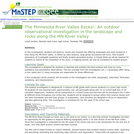
This outdoor investigation involves students observing, recording, comparing and pondering the differing …
This outdoor investigation involves students observing, recording, comparing and pondering the differing landscapes and rocks located along a river. Follow-up class sessions involve student generation of investigable questions, student-generated studies with required write-up and a mapping activity.
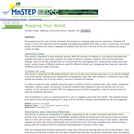
MASLab (Mobile Autonomous System Laboratory), also known as 6.186, is a robotics …
MASLab (Mobile Autonomous System Laboratory), also known as 6.186, is a robotics contest. The contest takes place during MIT's Independent Activities Period and participants earn 6 units of P/F credit and 6 Engineering Design Points. Teams of three to four students have less than a month to build and program sophisticated robots which must explore an unknown playing field and perform a series of tasks. MASLab provides a significantly more difficult robotics problem than many other university-level robotics contests. Although students know the general size, shape, and color of the floors and walls, the students do not know the exact layout of the playing field. In addition, MASLab robots are completely autonomous, or in other words, the robots operate, calculate, and plan without human intervention. Finally, MASLab is one of the few robotics contests in the country to use a vision based robotics problem.
A guide for exploring some of the options for exploring the world …
A guide for exploring some of the options for exploring the world using Mapping and Streetview technology. It looks at how Streetview works, where you can use it, how you can contribute to it, and some of the amazing geo-exploration options it opens up for our schools. We’ll delve into Maps, Expeditions, and the Google Cultural Institute to see how these amazing tools can be used to add depth to our curriculum and literally be the next best thing to being there.
This is a digitalized collection of this once popular cartographic form used …
This is a digitalized collection of this once popular cartographic form used to depict U.S. and Canadian cities and towns during the late nineteenth and early twentieth centuries. Known also as bird's-eye views, perspective maps, and aero views, panoramic maps are non-photographic representations of cities portrayed as if viewed from above at an oblique angle. Although not generally drawn to scale, they show street patterns, individual buildings, and major landscape features in perspective.
Map shows census divisions (a variably sized region ranging from 1100 and …
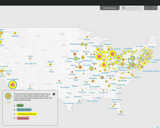
Map shows census divisions (a variably sized region ranging from 1100 and 2.5 million people) color coded by the percentage of people living in the area that lived in a different province or territory five years ago. CDs in sparsely populated regions are excluded. The map suggests that there is a great deal of migration into Alberta -- likely to work in the oil industry.
Projections and coordinates are key advancements in the geographic sciences that allow …
Projections and coordinates are key advancements in the geographic sciences that allow us to better understand the nature of the Earth and how to describe location. These innovations in describing the Earth are the basis for everything that is done in a GIS framework. Shape of the Earth is a critical starting point because in fact the Earth is not round but rather a more complex shape called a geoid. Coordinate systems are often referenced to a particular model shape of the Earth, but many different formats exist because not all coordinates work equally well in all areas. While projections and coordinates are abstract concepts in themselves, students eventually find them interesting because 1) it causes them to challenge their current ideas of the Earth's shape and 2) it is much easier to visualize these ideas for learning through interactive GIS such as Google Earth.
This introductory book on Remote Sensing is intended to be the equivalent …
This introductory book on Remote Sensing is intended to be the equivalent of a textbook for an undergraduate-level university course. There is also a French version titled "Télédétection".
Students learn and practice how to find the perimeter of a polygonal …
Students learn and practice how to find the perimeter of a polygonal shape. Using a ruler, they measure model rooms made of construction paper walls. They learn about other tools, such as a robot, that can help them take measurements. Using a robot built from a LEGO® MINDSTORMS® NXT kit that has been programmed to move along a wall and output the length of that wall, students record measurements and compare the perimeter value found with the robot to the perimeter found using a ruler. In both cases, students sketch maps to the scale of the model room and label the measured lengths. A concluding discussion explores the ways in which using a robot may be advantageous or disadvantageous, and real-world applications.
In a simulation of potential future space missions to Europa, one of …
In a simulation of potential future space missions to Europa, one of Jupiter’s moons, student teams are challenged to direct a robot placed in an enclosed maze to search for and find the most “alien life.” The robot is equipped with a camera to send a live feed of its surroundings in the maze. Students control the robot from outside the maze by looking at the live feed on a smartphone and using the robot’s remote control, making a map as they go. The student teams compete as if they are space agencies creating their own exploratory systems to meet the challenge’s criteria and constraints and prove “in the field” that they have the best plan to win the mission contract and get the job. This activity simulates the real-world research of scientists and engineers developing a robot with the capabilities to explore under the ice-covered surface of Europa.
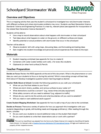
This is a mapping activity that uses the student’s schoolyard to investigate …
This is a mapping activity that uses the student’s schoolyard to investigate how rain/stormwater interacts with different surfaces and where stormwater problems may occur. Students use Next Generation Science Standards’ Science and Engineering Practices in a near-by, relevant place.
No restrictions on your remixing, redistributing, or making derivative works. Give credit to the author, as required.
Your remixing, redistributing, or making derivatives works comes with some restrictions, including how it is shared.
Your redistributing comes with some restrictions. Do not remix or make derivative works.
Most restrictive license type. Prohibits most uses, sharing, and any changes.
Copyrighted materials, available under Fair Use and the TEACH Act for US-based educators, or other custom arrangements. Go to the resource provider to see their individual restrictions.