This resource is a video abstract of a research paper created by …
This resource is a video abstract of a research paper created by Research Square on behalf of its authors. It provides a synopsis that's easy to understand, and can be used to introduce the topics it covers to students, researchers, and the general public. The video's transcript is also provided in full, with a portion provided below for preview:
"Microbiomes are more than just prokaryotes and viruses; they also contain important eukaryotes, including fungi and protists. However, eukaryotes are difficult to study using ‘shotgun’ metagenomics, as their signal is often overwhelmed by the prokaryotes. Some methods use eukaryote-specific marker genes, but they can’t detect eukaryotes that aren’t in the reference marker gene set, and such methods are not compatible with web-based tools for downstream analysis. But CORRAL (Clustering Of Related Reference ALignments) is designed to close those gaps. CORRAL identifies eukaryotes in metagenomic data based on alignments to eukaryote-specific marker genes and Markov clustering. It can detect microbial eukaryotes that are not included in the marker gene reference set. The process is even automated and can be carried out at scale. A recent paper demonstrates CORRAL’s sensitivity and accuracy with simulated datasets, mock community standards, and human microbiome datasets..."
The rest of the transcript, along with a link to the research itself, is available on the resource itself.
Students will examine how technology is changing or eliminated careers that currently …
Students will examine how technology is changing or eliminated careers that currently exist. Students will draw conclusions and develop hypotheses about these current careers and the changes that could possibly occur based on technology.
Teachers will engage students in a discussion about what the Census Bureau …
Teachers will engage students in a discussion about what the Census Bureau does and what types of information it collects. Then students will read and annotate informational texts from the Census Bureau and work with a partner to answer questions about the texts. Students will also analyze an infographic of people with different professions to determine how each of those people might use the data gathered by the Census Bureau; students will be asked to use evidence from the infographic text to support their answers. Students will then complete a wireframe (similar to a graphic organizer) for an online resource about how census data can help their own community.
Students will analyze a variety of county-level census data, including on employment, …
Students will analyze a variety of county-level census data, including on employment, technology, and transportation, in histograms to compare and contrast the shapes of their distributions and to interpret measures of center and spread in context.
This activity provides students with the opportunity to gather data from a …
This activity provides students with the opportunity to gather data from a controlled experiment setting, interpret their findings and use the data to draw conclusions to solve a mystery.
Living in a big city like New York can be very challenging. …
Living in a big city like New York can be very challenging. City planning is an interdisciplinary enterprise where social scientists, humanists, psychologists, scientists, statisticians, citizens, politicians, etc. come together to offer solutions to improve quality of life in the city. To find such solutions, these people need clear and reliable (qualitative and quantitative) information about specific challenges that residents and visitors face For the variety of stakeholders in the city, many different things might be considered worthy of study, depending on their interests and needs regarding, e.g., employment, financial status, family size, healthcare, mobility, and education. For example, do you know whether your neighborhood issufficiently protected from a fire? What about other neighborhoods in the city? To what extent does a CUNY degree help a person gain employment in the City? In which ways do race or gender or sexual preference play a role in how people experience city life? Can these be quantified in dollar terms? Once you have identified a problem, write an essay that describes a question about city life that you believe is worthy of a statistical study.
This course introduces the concepts, techniques, and devices used to measure engineering …
This course introduces the concepts, techniques, and devices used to measure engineering properties of materials. There is an emphasis on measurement of load-deformation characteristics and failure modes of both natural and fabricated materials. Weekly experiments include data collection, data analysis, and interpretation and presentation of results.
This activity is a classroom and schoolyard investigation where students collect daily …
This activity is a classroom and schoolyard investigation where students collect daily temperature and precipitation readings, weather observations, and weekly phenology reports in a phenology binder and in nature journals. Students then analyze this data and compare to recorded values in the Weatherguide calendar.
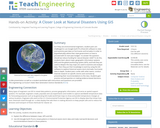
As if they are environmental engineers, student pairs are challenged to use …
As if they are environmental engineers, student pairs are challenged to use Google Earth Pro (free) GIS software to view and examine past data on hurricanes and tornados in order to (hypothetically) advise their state government on how to proceed with its next-year budget—to answer the question: should we reduce funding for natural disaster relief? To do this, students learn about maps, geographic information systems (GIS) and the global positioning system (GPS), and how they are used to deepen the way maps are used to examine and analyze data. Then they put their knowledge to work by using the GIS software to explore historical severe storm (tornado, hurricane) data in depth. Student pairs confer with other teams, conduct Internet research on specific storms and conclude by presenting their recommendations to the class. Students gain practice and perspective on making evidence-based decisions. A slide presentation as well as a student worksheet with instructions and questions are provided.
This course provides an introductory survey of data science tools in healthcare. …
This course provides an introductory survey of data science tools in healthcare. It was created by members of MIT Critical Data, a global consortium consisting of healthcare practitioners, computer scientists, and engineers from academia, industry, and government, that seeks to place data and research at the front and center of healthcare operations. The most daunting global health issues right now are the result of interconnected crises. In this course, we highlight the importance of a multidisciplinary approach to health data science. It is intended for front-line clinicians and public health practitioners, as well as computer scientists, engineers, and social scientists, whose goal is to understand health and disease better using digital data captured in the process of care. What you'll learn:
Principles of data science as applied to health Analysis of electronic health records Artificial intelligence and machine learning in healthcare
This course is part of the Open Learning Library, which is free to use. You have the option to sign up and enroll in the course if you want to track your progress, or you can view and use all the materials without enrolling.
Communicating With Data has a distinctive structure and content, combining fundamental quantitative …
Communicating With Data has a distinctive structure and content, combining fundamental quantitative techniques of using data to make informed management decisions with illustrations of how real decision makers, even highly trained professionals, fall prey to errors and biases in their understanding. We present the fundamental concepts underlying the quantitative techniques as a way of thinking, not just a way of calculating, in order to enhance decision-making skills. Rather than survey all of the techniques of management science, we stress those fundamental concepts and tools that we believe are most important for the practical analysis of management decisions, presenting the material as much as possible in the context of realistic business situations from a variety of settings. Exercises and examples drawn from marketing, finance, operations management, strategy, and other management functions.
Students groups create scientific research posters to professionally present the results of …
Students groups create scientific research posters to professionally present the results of their AQ-IQ research projects, which serves as a conclusion to the unit. (This activity is also suitable to be conducted independently from its unit—for students to make posters for any type of project they have completed.) First, students critically examine example posters to gain an understanding of what they contain and how they can be made most effective for viewers. Then they are prompted to analyze and interpret their data, including what statistics and plots to use in their posters. Finally, groups are given a guide that aids them in making their posters by suggesting all the key components one would find in any research paper or presentation. This activity is suitable for presenting final project posters to classmates or to a wider audience in a symposium or expo environment. In addition to the poster-making guide, three worksheets, six example posters, a rubric and a post-unit survey are provided.
Students will compare data for two states using comparison symbols and both …
Students will compare data for two states using comparison symbols and both rounded and unrounded (exact) numbers. Students will then write their own question to compare the data.
In this model eliciting activity (MEA), students are hired by a travel …
In this model eliciting activity (MEA), students are hired by a travel magazine to determine if two airlines that fly into Chicago are equally reliable. They examine data of flight arrival delay times for both airlines flying out of the same city. They first identify measures that can be used to compare the two airlines. Working in small groups, the students decide the size of a meaningful difference between the airlines for each measure and use that information to determine a rule that for deciding if one airline is more reliable than another. The students apply their rule to flight arrival delay data for the two airlines from four additional departure cities, and use the results to write a report to the magazine editor on whether or not one airline is more reliable than the other. This activity can serve as an introduction to ideas of central tendency and variability, and prepares students for formal approaches to comparing groups.
This assignment exposes students to data on economic growth and development as …
This assignment exposes students to data on economic growth and development as commonly measured by per capita GDP and the Human Development Index (HDI) for 100 countries of the world. There is a big debate about how good an indicator HDI is compared to GDP per capita as a measure of development.
Why study Quantitative Literacy? Most students sign up for this course to …
Why study Quantitative Literacy?
Most students sign up for this course to fulfill a general education mathematics requirement. And this text is certainly aimed at that general audience. But by the time the course is completed, the authors hope that you will have developed some appreciation for the usefulness and elegance of the subject. Without doubt, some level of competency and comfort in working with numerical data is needed to navigate the modern world; and we have tried to cover topics that can be used in day to day life.
In this book, we will focus on problem solving and critical thinking skills. Our goal is not to prepare you just for the next math class, but to equip you with the necessary tools so that you can apply basic mathematical reasoning to a wide variety of commonly encountered problems. Along the way, we will learn basic logic, how to work with percentages and units, the basics of consumer finance, and how to use and interpret basic statistical data.
This activity asks students to work in a team to develop a …
This activity asks students to work in a team to develop a set of rules that can be used to program a SPAM filter for a client. The rules are based on characteristics of the subject lines of emails. Students are given samples of SPAM and non-SPAM subject lines to examine. After their rules are ready, they are given a test set of data to use and are asked to come up with a numerical measure to quantify how well their method (model) works. Each team writes a report describing how their model works and how well it performed on the test data. This activity could serve as an introduction to ideas of classification. Alternatively, the activity could be the basis for student introduction to types of statistical errors.
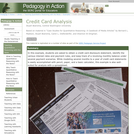
In this example, students are asked to obtain a credit card disclosure …
In this example, students are asked to obtain a credit card disclosure statement, identify the various interest rates and payment rules, and keep track of a revolving monthly balance under several payment scenarios. While modeling several months to a year of credit card statements is easily accomplished with pencil, paper, and a basic calculator, this example is also well-suited for analysis with a spreadsheet.
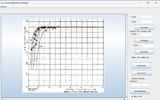
You may have already had to digitize a curve from an original …
You may have already had to digitize a curve from an original document in the form of an image, which is quite tedious to do by hand.
To facilitate the digitization of curves, we have created a small utility that allows you to display on the screen the previously scanned image of a graph, then to very easily record the points of the curves you are interested in (up to 2000).
Are you ready to leave the sandbox and go for the real …
Are you ready to leave the sandbox and go for the real deal? Have you followed Data Analysis: Take It to the MAX() and Data Analysis: Visualization and Dashboard Design and are ready to carry out more robust data analysis?
In this project-based course you will engage in a real data analysis project that simulates the complexity and challenges of data analysts at work. Testing, data wrangling, Pivot Tables, sparklines? Now that you have mastered them you are ready to apply them all and carry out an independent data analysis.
For your project, you will pick one raw dataset out of several options, which you will turn into a dashboard. You will begin with a business question that is related to the dataset that you choose. The datasets will touch upon different business domains, such as revenue management, call-center management, investment, etc.
No restrictions on your remixing, redistributing, or making derivative works. Give credit to the author, as required.
Your remixing, redistributing, or making derivatives works comes with some restrictions, including how it is shared.
Your redistributing comes with some restrictions. Do not remix or make derivative works.
Most restrictive license type. Prohibits most uses, sharing, and any changes.
Copyrighted materials, available under Fair Use and the TEACH Act for US-based educators, or other custom arrangements. Go to the resource provider to see their individual restrictions.