This textbook is part of the OpenIntro Statistics series and offers complete …
This textbook is part of the OpenIntro Statistics series and offers complete coverage of the high school AP Statistics curriculum. Real data and plenty of inline examples and exercises make this an engaging and readable book. Links to lecture slides, video overviews, calculator tutorials, and video solutions to selected end of chapter exercises make this an ideal choice for any high school or Community College teacher. In fact, Portland Community College recently adopted this textbook for its Introductory Statistics course, and it estimates that this will save their students $250,000 per year. Find out more at: openintro.org/ahss
View our video tutorials here: openintro.org/casio openintro.org/TI
This class covers the analysis and modeling of stochastic processes. Topics include …
This class covers the analysis and modeling of stochastic processes. Topics include measure theoretic probability, martingales, filtration, and stopping theorems, elements of large deviations theory, Brownian motion and reflected Brownian motion, stochastic integration and Ito calculus and functional limit theorems. In addition, the class will go over some applications to finance theory, insurance, queueing and inventory models.
This assignment was designed for students in the pathways introductory chemistry class …
This assignment was designed for students in the pathways introductory chemistry class and the first year seminar and aligns with the Inquiry and Problem Solving core competency. In this context, there is a focus on framing the issues (identifies and/or addresses questions and problems), evidence gathering (assembles, reviews and synthesizes evidence from several diverse sources), evidence (analyze the data to address the questions posed) and conclusions (critical thinking, reflect on the outcomes, draw conclusions and generate new knowledge). There is also a Global Learning component based on comparing data collected locally with corresponding data from other locations or countries. The assignment includes the written communication ability with a focus on "Content Development and Organization," as well as the clarity of the communication and its purpose. The overall aim of this assignment is to enhance students' conceptual learning and understanding of key issues related to society as well as their course. This assignment was developed as part of a LaGuardia Global Learning mini-grant and CUNY Experiential Learning and Research in the Classroom mini-grants. The assignment will be scaffolded over about 3 weeks and is worth about 10% of the final grade. To further increase the success of this assignment, instructors might want to consider the following: Use class discussions to focus on the relevance and importance of conceptual learning. In order to improve the data analysis aspect, incorporating class demonstrations of how to conduct the analysis and guide discussions about what the data means. Giving students more detailed rubrics with formal expectations of the requirements of the assignments, particularly in the written format Find ways to increase student participation in class discussions. When this assignment has been utilized in previous semesters, students clearly displayed the capability to relate the co-curricular experiences in the data collection and its analysis to concepts and ideas covered during class. Evidence for this came from very dynamic and interactive class discussions based on air pollution as well as from the output of the written assignment, in which students were able to relate the nature, sources and chemical properties of the pollutants to their impact on the environment, health and society in general. LaGuardia's Core Competencies and Communication Abilities List the Program Goal(s) that this assignment targets Global Learning based on comparing pollutant levels around the LaGuardia campus with those in other locations or countries. It is also an IPS assignment, incorporating scientific literacy and thinking, as students need to analyze the data, interpret it and reflect on the outcomes. List the Student Learning Objective(s) that this assignment targets Identify and apply fundamental chemical concepts and methods. Gather, analyze, and interpret data. List the Course Objectives(s) that this assignment targets Explore the complex connections between chemistry and society. Apply chemical principles to real world issues, including ethical aspects. Gather, analyze, and interpret data. Write a short description of the pedagogy involved in executing this assignment Students collect and analyze the data, interpret the results in terms of pollution levels, safety and ethics and compare with EPA standard levels and with levels in other countries. Outside the classroom events will be organized for data collection. There will be class and group-based discussions focused on the data, its analysis and the connections to society.
This online set of activities help students learn properties of ocean waves, …
This online set of activities help students learn properties of ocean waves, wind-wave relationships and properties of tsunamis.
(Note: this resource was added to OER Commons as part of a batch upload of over 2,200 records. If you notice an issue with the quality of the metadata, please let us know by using the 'report' button and we will flag it for consideration.)
This activity introduces students to high precision GPS as it is used …
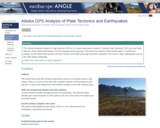
This activity introduces students to high precision GPS as it is used in geoscience research. Students build "gumdrop" GPS units and study data from three Alaska GPS stations from the Plate Boundary Observatory network. They learn how Alaska's south central region is "locked and loading" as the Pacific Plate pushes into North America and builds up energy that will be released in the future in other earthquakes such as the 1964 Alaska earthquake.
(Note: this resource was added to OER Commons as part of a batch upload of over 2,200 records. If you notice an issue with the quality of the metadata, please let us know by using the 'report' button and we will flag it for consideration.)
OER Fundamentals are invited to remix this course planning template to design and …
OER Fundamentals are invited to remix this course planning template to design and share their OER project plans, course information and syllabus, and reflection.
In this module, students reconnect with and deepen their understanding of statistics …
In this module, students reconnect with and deepen their understanding of statistics and probability concepts first introduced in Grades 6, 7, and 8. Students develop a set of tools for understanding and interpreting variability in data, and begin to make more informed decisions from data. They work with data distributions of various shapes, centers, and spreads. Students build on their experience with bivariate quantitative data from Grade 8. This module sets the stage for more extensive work with sampling and inference in later grades.
Find the rest of the EngageNY Mathematics resources at https://archive.org/details/engageny-mathematics.
This lesson centers around the How AI Works: Equal Access and Algorithmic …
This lesson centers around the How AI Works: Equal Access and Algorithmic Bias video from the How AI Works video series. Watch this video first before exploring the lesson plan.
In this lesson, students will practice cropping images to uncover the bias underlying the Twitter cropping algorithm. Then, students will read and watch a video about the discovery of this biased algorithm. Finally, students will discuss ways to recognize and reduce bias along with analyzing Twitter's response to the allegations of bias in their cropping algorithm.
This lesson can be taught on its own, or as part of a 7-lesson sequence on How AI Works. Duration: 45 minutes
This is a graduate-level introduction to the principles of statistical inference with …
This is a graduate-level introduction to the principles of statistical inference with probabilistic models defined using graphical representations. The material in this course constitutes a common foundation for work in machine learning, signal processing, artificial intelligence, computer vision, control, and communication. Ultimately, the subject is about teaching you contemporary approaches to, and perspectives on, problems of statistical inference.
This problem illustrates how numerical theories are developed, how we might test …
This problem illustrates how numerical theories are developed, how we might test this theory with an analog model, and how numerical models are constructed and the limitations of numerical modeling.
(Note: this resource was added to OER Commons as part of a batch upload of over 2,200 records. If you notice an issue with the quality of the metadata, please let us know by using the 'report' button and we will flag it for consideration.)
Students will look at data showing how the “millennial” generation differs from …
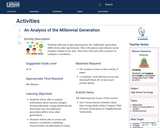
Students will look at data showing how the “millennial” generation differs from other generations. They will analyze and evaluate social changes evident in the data. Then they will work with a partner to compose a newsletter.
Word Count: 15331 (Note: This resource's metadata has been created automatically by …
Word Count: 15331
(Note: This resource's metadata has been created automatically by reformatting and/or combining the information that the author initially provided as part of a bulk import process.)
Comparative planetary geology requires understanding how geological processes are affected by changes …
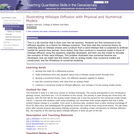
Comparative planetary geology requires understanding how geological processes are affected by changes in physical environment-each planet and moon provides an opportunity to refine our understanding of how physical geological processes operate. Volcanism is a great example of a major geological process highly susceptible to such variations. Students performing this exercise will constrain how "Amboy Crater" would look if the same eruption happened on the Moon and Mars. Part 1 of the exercise asks small groups to assess either the yield strength of the Amboy flows or the time required for the flow to travel a given distance. After discussion of the results, Part 2 asks students to characterize the dimensions of the same flow, if emplaced on Mars or the Moon (changing only gravitational acceleration), and the time required for it to form; they are asked to predict the outcome in advance. Part 3 uses "Erupt" freeware by Ken Wohletz to explore how gravity changes will affect cinder cone geometry; the model is tested first to see if it correctly predicts an Amboy-like geometry, and afterwards students are asked to brainstorm what other factors should also be modified to improve the accuracy of the simulation, and how these changes would be expected to affect the geomorphological outcome. Finally, Part 4 asks students to use simple ballistic equations, implemented via an online Applet (Stromboli), to constrain the launch angle and starting velocity for the eruption that formed Amboy Crater (modifications are supposedly underway to permit this applet to run with different values of gravitational acceleration and air resistance).
(Note: this resource was added to OER Commons as part of a batch upload of over 2,200 records. If you notice an issue with the quality of the metadata, please let us know by using the 'report' button and we will flag it for consideration.)
This course presents real-world examples in which quantitative methods provide a significant …
This course presents real-world examples in which quantitative methods provide a significant competitive edge that has led to a first order impact on some of today's most important companies. We outline the competitive landscape and present the key quantitative methods that created the edge (data-mining, dynamic optimization, simulation), and discuss their impact.
This course covers the key quantitative methods of finance: financial econometrics and …
This course covers the key quantitative methods of finance: financial econometrics and statistical inference for financial applications; dynamic optimization; Monte Carlo simulation; stochastic (Itô) calculus. These techniques, along with their computer implementation, are covered in depth. Application areas include portfolio management, risk management, derivatives, and proprietary trading.
Students will explore maps containing census data from 1950 through 2000. They …
Students will explore maps containing census data from 1950 through 2000. They will analyze how education levels and median household incomes have changed over time and determine how the two might be correlated. Students will also come up with ideas for policies that could help address issues related to income and education.
A student activity to determine the angle of repose and what factors …
A student activity to determine the angle of repose and what factors determine the angle of repose.
(Note: this resource was added to OER Commons as part of a batch upload of over 2,200 records. If you notice an issue with the quality of the metadata, please let us know by using the 'report' button and we will flag it for consideration.)
Students will read an informational text about variations in college completion rates …
Students will read an informational text about variations in college completion rates for people born in different years. To help students better understand the text, the teacher will model how to annotate the first half. Students will then annotate the second half themselves. After that, students will answer a series of questions about the text, drawing inferences from what they’ve read and citing textual evidence to support their responses.
Students will examine a table of 1850 Census data on employment to …
Students will examine a table of 1850 Census data on employment to understand the professions of free men across the United States at the time, calculating the percentages working in different industries. Students will also compare and contrast economies in the North and South during the Antebellum Period.
No restrictions on your remixing, redistributing, or making derivative works. Give credit to the author, as required.
Your remixing, redistributing, or making derivatives works comes with some restrictions, including how it is shared.
Your redistributing comes with some restrictions. Do not remix or make derivative works.
Most restrictive license type. Prohibits most uses, sharing, and any changes.
Copyrighted materials, available under Fair Use and the TEACH Act for US-based educators, or other custom arrangements. Go to the resource provider to see their individual restrictions.

![Air Pollution [Liberal Arts: Math and Science/Natural Science]](https://img.oercommons.org/160x134/oercommons/media/upload/materials/screenshots/materials-course-280650.png)