This is a laboratory course supplemented by lectures that focus on selected …
This is a laboratory course supplemented by lectures that focus on selected analytical facilities that are commonly used to determine the mineralogy, elemental abundance and isotopic ratios of Sr and Pb in rocks, soils, sediments and water.
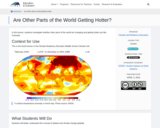
College-level adaptation of a chapter in the Earth Exploration Toolbook. Examine satellite …
College-level adaptation of a chapter in the Earth Exploration Toolbook. Examine satellite images of atmospheric ozone in the Southern Hemisphere to study changes in concentration over a time.
(Note: this resource was added to OER Commons as part of a batch upload of over 2,200 records. If you notice an issue with the quality of the metadata, please let us know by using the 'report' button and we will flag it for consideration.)
Instructional sequences are more coherent when students investigate compelling natural phenomena (in …
Instructional sequences are more coherent when students investigate compelling natural phenomena (in science) or work on meaningful design problems (in engineering) by engaging in the science and engineering practices. We refer to these phenomena and design problems here as ‘anchors.’Here is a tool to assist in determining if the elements of the anchoring phenomenon are strong or could use some additional thinking. Original works can be found at NextGenStorylines.org
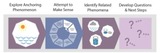
The Anchoring Phenomenon Routine is the launch to student investigation around the …
The Anchoring Phenomenon Routine is the launch to student investigation around the anchoring phenomenon. This phenomenon will be the one that students will describe and explain, using disciplinary core ideas, science and engineering practices and crosscutting concepts in investigations. The Anchoring Phenomenon Routine will encourage thoughtful consideration of the phenomenon, initial models, connections to related phenomenon, discussions about the phenomenon and the creation of the KLEWS chart used for documenting student learning. In an Anchoring Phenomenon Routine, students: ● Are presented with a phenomenon or design problem ● Write and discuss what they notice and wonder about from the initial presentation ● Create and compare initial models of the phenomenon or problem ● Identify related experiences and knowledge that they could draw upon to explain the phenomenon or solve the problem ● Construct a KLEWS Chart ● Identify potential investigations to answer the questions on the KLEWS Chart, adding the questions to the chart
What would happen if a portion of the Antarctic Ice Sheet were …
What would happen if a portion of the Antarctic Ice Sheet were to melt? This video segment adapted from NOVA uses animations to show the effect of a 6-meter sea-level rise on coastal cities across the world.
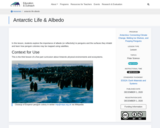
In this lesson, students explore the importance of albedo (or reflectivity) to …
In this lesson, students explore the importance of albedo (or reflectivity) to penguins and the surfaces they inhabit and learn how penguin colonies may be mapped using satellites.
This video segment adapted from NOVA uses microwave images to reveal how …
This video segment adapted from NOVA uses microwave images to reveal how sea ice doubles the size of Antarctica each winter. Rare footage shows how sea ice crushed the famous ship Endurance in 1914.
This classroom activity introduces students to Antarctica's organisms, landscapes, and seascapes. After …
This classroom activity introduces students to Antarctica's organisms, landscapes, and seascapes. After examining the images in the photo gallery, students work in small groups to discuss their conclusions about the living conditions on this continent. The printable three-page handout includes a series of questions to help students structure their thoughts while viewing the gallery images and a group worksheet that guides students through a discussion of their evolving hypotheses and conclusions.
This course focuses on the practical applications of the continuum concept for …
This course focuses on the practical applications of the continuum concept for deformation of solids and fluids, emphasizing force balance. Topics include stress tensor, infinitesimal and finite strain, and rotation tensors. Constitutive relations applicable to geological materials, including elastic, viscous, brittle, and plastic deformation are studied.
This lab exercise provides students with activities utilizing vector operations within the …
This lab exercise provides students with activities utilizing vector operations within the context of the atmospheric and oceanic environments.
(Note: this resource was added to OER Commons as part of a batch upload of over 2,200 records. If you notice an issue with the quality of the metadata, please let us know by using the 'report' button and we will flag it for consideration.)
This short video from NASA discusses the role that salinity plays in …
This short video from NASA discusses the role that salinity plays in Earth's climate and ocean circulation, focusing on the observations of the Aquarius satellite.
Living Atlas Indicators of the Planet provide the user with up-to-date data, …
Living Atlas Indicators of the Planet provide the user with up-to-date data, maps, graphs, charts, animation and other visuals to explore the science of climate and environmental change. 18 indicators from Air Quality to Women in Parliament can be explored.
In this short video, host Dr. Ryan interviews graduate student Amy Steiker …
In this short video, host Dr. Ryan interviews graduate student Amy Steiker at the Institute of Arctic and Alpine Research about her research, using isotopes of nitrous oxide, connecting human activity to greenhouse gas emissions.
Students will complete this survey that determines their personal and household contributions …
Students will complete this survey that determines their personal and household contributions to atmospheric Carbon dioxide by using information about their previous year's consumption. They will understand that Carbon dioxide is a greenhouse gas produced by the combustion of fossil fuels, and that its production can be minimized by taking personal steps to conserve.
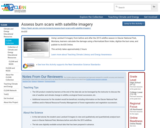
Using Landsat 8 imagery from before and after the 2015 wildfire season …
Using Landsat 8 imagery from before and after the 2015 wildfire season in Glacier National Park, Montana, learners calculate the damage using a Normalized Burn Index, digitize the burn area, and publish to ArcGIS Online.
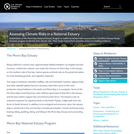
Stakeholders of the Morro Bay National Estuary Program in California worked with …
Stakeholders of the Morro Bay National Estuary Program in California worked with resources from the EPA's Climate Ready Estuaries program to identify their climate risks. Their results helped them prioritize actions for building resilience.
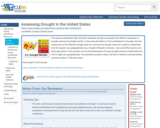
This easy-to-understand video animation describes drought and explains the different categories of …
This easy-to-understand video animation describes drought and explains the different categories of drought used by the drought monitor. It discusses the effects of and contributions to drought, what the implications of the different drought levels are, and puts the drought maps into context to understand how the impacts vary geographically (e.g. drought in Nevada vs Kansas - one could affect tourism, the other agriculture). It also touches on how the development of maps/drought severity is determined and how it might vary geographically. The animation provides a basic overview of statistics and percentiles and the concept of '100 year events.'
No restrictions on your remixing, redistributing, or making derivative works. Give credit to the author, as required.
Your remixing, redistributing, or making derivatives works comes with some restrictions, including how it is shared.
Your redistributing comes with some restrictions. Do not remix or make derivative works.
Most restrictive license type. Prohibits most uses, sharing, and any changes.
Copyrighted materials, available under Fair Use and the TEACH Act for US-based educators, or other custom arrangements. Go to the resource provider to see their individual restrictions.