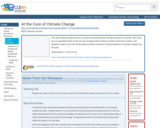
In this 6-part activity, students learn about climate change during the Cenozoic …
In this 6-part activity, students learn about climate change during the Cenozoic and the abrupt changes at the Cretaceous/Paleogene boundary (65.5 million years ago), the Eocene/Oligocene boundary (33.9 million years ago), and the Paleocene/Eocene boundary (55.8 million years ago).
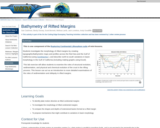
This module examines the nature and variability of subduction margins through examination …
This module examines the nature and variability of subduction margins through examination of data sets that document subduction zone inputs, deformation, and resulting morphology in different settings.
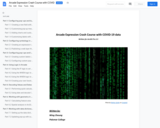
This assignment was designed for students in the pathways introductory chemistry class …
This assignment was designed for students in the pathways introductory chemistry class and the first year seminar and aligns with the Inquiry and Problem Solving core competency. In this context, there is a focus on framing the issues (identifies and/or addresses questions and problems), evidence gathering (assembles, reviews and synthesizes evidence from several diverse sources), evidence (analyze the data to address the questions posed) and conclusions (critical thinking, reflect on the outcomes, draw conclusions and generate new knowledge). There is also a Global Learning component based on comparing data collected locally with corresponding data from other locations or countries. The assignment includes the written communication ability with a focus on "Content Development and Organization," as well as the clarity of the communication and its purpose. The overall aim of this assignment is to enhance students' conceptual learning and understanding of key issues related to society as well as their course. This assignment was developed as part of a LaGuardia Global Learning mini-grant and CUNY Experiential Learning and Research in the Classroom mini-grants. The assignment will be scaffolded over about 3 weeks and is worth about 10% of the final grade. To further increase the success of this assignment, instructors might want to consider the following: Use class discussions to focus on the relevance and importance of conceptual learning. In order to improve the data analysis aspect, incorporating class demonstrations of how to conduct the analysis and guide discussions about what the data means. Giving students more detailed rubrics with formal expectations of the requirements of the assignments, particularly in the written format Find ways to increase student participation in class discussions. When this assignment has been utilized in previous semesters, students clearly displayed the capability to relate the co-curricular experiences in the data collection and its analysis to concepts and ideas covered during class. Evidence for this came from very dynamic and interactive class discussions based on air pollution as well as from the output of the written assignment, in which students were able to relate the nature, sources and chemical properties of the pollutants to their impact on the environment, health and society in general. LaGuardia's Core Competencies and Communication Abilities List the Program Goal(s) that this assignment targets Global Learning based on comparing pollutant levels around the LaGuardia campus with those in other locations or countries. It is also an IPS assignment, incorporating scientific literacy and thinking, as students need to analyze the data, interpret it and reflect on the outcomes. List the Student Learning Objective(s) that this assignment targets Identify and apply fundamental chemical concepts and methods. Gather, analyze, and interpret data. List the Course Objectives(s) that this assignment targets Explore the complex connections between chemistry and society. Apply chemical principles to real world issues, including ethical aspects. Gather, analyze, and interpret data. Write a short description of the pedagogy involved in executing this assignment Students collect and analyze the data, interpret the results in terms of pollution levels, safety and ethics and compare with EPA standard levels and with levels in other countries. Outside the classroom events will be organized for data collection. There will be class and group-based discussions focused on the data, its analysis and the connections to society.
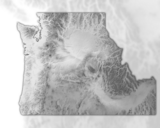
An interactive map based on four decades of satellite images helps residents, …
An interactive map based on four decades of satellite images helps residents, resource managers, and stewards of the land anticipate and plan for coastal change.
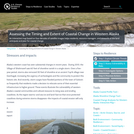
This 2018 edition is the first to be released in a digital, …
This 2018 edition is the first to be released in a digital, fully-interactive format, designed to highlight facets of the Pacific Northwest landscape with novel approaches to data presentation. Where previous editions of the atlas were designed to ask and answer questions, this atlas serves as a platform for the geographically curious to explore the region, providing as many critical questions as it does critical answers.
Beyond this page are maps of the familiar and the unfamiliar. Migration maps highlight human movement between the Pacific Northwest and the rest of the United States; a wildfire timeline chronicles the year-to-year spread of modern and historical fires; and the watershed guide abandons traditional political boundaries in favor of natural, hydrological borders. All data in the atlas were gathered from publically accessible sources, compiled using open-source software and coding libraries. This is an atlas designed to be open, responsive, and to satisfy the geographic curiosity of any and all interested.
This video shows where and how ice cores are extracted from the …
This video shows where and how ice cores are extracted from the West Antarctic Ice Sheet. The cores are cut, packaged, flown to the ice core storage facility in Denver, further sliced into samples, and shipped to labs all over the world where scientists use them to study indicators of climate change from the past.
This is one component of the Rupturing Continental Lithosphere suite of mini-lessons. …
This is one component of the Rupturing Continental Lithosphere suite of mini-lessons. Students investigate the morphology of rifted margins by creating topographic/bathymetric maps and profiles across the Red Sea and the Gulf of California (using GeoMapApp ), and describe north-to-south variations in basin morphology in the Gulf of California (including making graphs using Excel). This lab exercise will allow students to examine the roles of structural evolution, sedimentation, and physical and chemical evolution of the crust in the rifting process. This lesson can act as an introduction to more detailed examinations of the roles of sedimentation and obliquity in rifted margins.
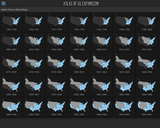
Blue Coral Atlas of US Expansion tells the geographic story of the …
Blue Coral Atlas of US Expansion tells the geographic story of the United States from the original thirteen colonies to today. View all the maps together in a single scroll or choose maps either individually or in series together for a closer look.
Blue Coral Atlas of US Expansion is fully responsive in the web browser for large and small devices in both horizontal and vertical orientations.
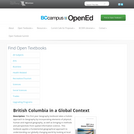
This first year Geography textbook takes a holistic approach to Geography by …
This first year Geography textbook takes a holistic approach to Geography by incorporating elements of physical, human and regional geography, as well as bringing in methods and perspectives from spatial information science.. This textbook applies a fundamental geographical approach to understanding our globally changing world by looking at local processes which are linked to larger global processes and events. For example mining and its effects are a global issue and we can see how these unfold in BC. A further example is the recent apology to First Nation peoples on the residential school treatment, as similar events occur in the US, Ireland and Australia. Processes of urbanization, a phenomenon which people all over the globe are experiencing, can be seen in Vancouver with our discussion of the citys development. Geography students, indeed all first year students, need to be able to critically assess their own contexts and environments in order to properly engage with our continually globalizing world.
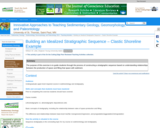
The purpose of this exercise is to guide students through the process …
The purpose of this exercise is to guide students through the process of constructing a stratigraphic sequence based on understanding relationships between the production of space and filling that space with sediment.
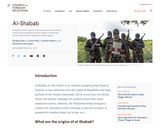
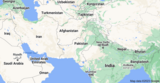
The Council on Foreign Relations (CFR) presents a backgrounder on Al-Shabab; an …
The Council on Foreign Relations (CFR) presents a backgrounder on Al-Shabab; an Islamist insurgent group that remains capable of carrying out massive attacks in Somalia and surrounding countries despite a decade-long African Union offensive against the Islamist group. CFR Backgrounders provide an in-depth analysis on current political and economic issues.
Word Count: 55857 (Note: This resource's metadata has been created automatically by …
Word Count: 55857
(Note: This resource's metadata has been created automatically by reformatting and/or combining the information that the author initially provided as part of a bulk import process.)
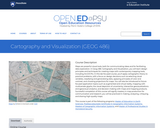
Maps capture the power of place. A well-designed map can stoke our …
Maps capture the power of place. A well-designed map can stoke our imagination, helping us to understand how a place looks or feels. Maps serve two roles. First, maps facilitate visual communication where knowns are presented to map readers. Second, maps permit visual thinking where insights into patterns and trends in spatial data are explored. In GEOG 486, Cartography & Visualization, you will learn and apply cartographic theory creating appropriately designed maps. You will learn how to associate the visual variables to symbolize types of spatial data. This process creates an appropriate visual hierarchy that conveys an informational hierarchy about the underlying message. Thus, techniques in map design will be applied to produce, evaluate, and critique reference and thematic maps.
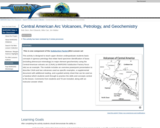
This module teaches basic concepts in igneous petrology through relating hand specimen …
This module teaches basic concepts in igneous petrology through relating hand specimen identification of lavas to major element geochemistry, using the Central American volcanic arc as an example.
Short Description: Un recorrido por la historia y cultura de Hispanoamérica, diseñado …
Short Description: Un recorrido por la historia y cultura de Hispanoamérica, diseñado para estudiantes de la lengua española a nivel intermedio.
Word Count: 102089
(Note: This resource's metadata has been created automatically by reformatting and/or combining the information that the author initially provided as part of a bulk import process.)
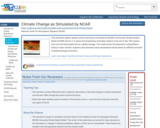
This animation depicts global surface warming as simulated by NCAR's Community Climate …
This animation depicts global surface warming as simulated by NCAR's Community Climate System Model (CCSM) Version 3. It shows the temperature anomalies relative to the end of the 19th century, both over the entire globe and as a global average. The model shows the temporary cooling effects during 5 major volcanic eruptions and estimates future temperature trends based on different amounts of greenhouse gas emissions.
This teaching activity is an introduction to how ice cores from the …
This teaching activity is an introduction to how ice cores from the cryosphere are used as indicators and record-keepers of climate change as well as how climate change will affect the cryosphere.
This activity focuses on reconstructing the Paleocene-Eocene Thermal Maximum (PETM) as an …
This activity focuses on reconstructing the Paleocene-Eocene Thermal Maximum (PETM) as an example of a relatively abrupt global warming period. Students access Integrated Ocean Drilling Program (IODP) sediment core data with Virtual Ocean software in order to display relevant marine sediments and their biostratigraphy.
No restrictions on your remixing, redistributing, or making derivative works. Give credit to the author, as required.
Your remixing, redistributing, or making derivatives works comes with some restrictions, including how it is shared.
Your redistributing comes with some restrictions. Do not remix or make derivative works.
Most restrictive license type. Prohibits most uses, sharing, and any changes.
Copyrighted materials, available under Fair Use and the TEACH Act for US-based educators, or other custom arrangements. Go to the resource provider to see their individual restrictions.
![Air Pollution [Liberal Arts: Math and Science/Natural Science]](https://img.oercommons.org/160x134/oercommons/media/upload/materials/screenshots/materials-course-280650.png)