Learn the fundamentals of machine learning to help you correctly apply various …
Learn the fundamentals of machine learning to help you correctly apply various classification and regression machine learning algorithms to real-life problems.
This assignment was designed for students in the pathways introductory chemistry class …
This assignment was designed for students in the pathways introductory chemistry class and the first year seminar and aligns with the Inquiry and Problem Solving core competency. In this context, there is a focus on framing the issues (identifies and/or addresses questions and problems), evidence gathering (assembles, reviews and synthesizes evidence from several diverse sources), evidence (analyze the data to address the questions posed) and conclusions (critical thinking, reflect on the outcomes, draw conclusions and generate new knowledge). There is also a Global Learning component based on comparing data collected locally with corresponding data from other locations or countries. The assignment includes the written communication ability with a focus on "Content Development and Organization," as well as the clarity of the communication and its purpose. The overall aim of this assignment is to enhance students' conceptual learning and understanding of key issues related to society as well as their course. This assignment was developed as part of a LaGuardia Global Learning mini-grant and CUNY Experiential Learning and Research in the Classroom mini-grants. The assignment will be scaffolded over about 3 weeks and is worth about 10% of the final grade. To further increase the success of this assignment, instructors might want to consider the following: Use class discussions to focus on the relevance and importance of conceptual learning. In order to improve the data analysis aspect, incorporating class demonstrations of how to conduct the analysis and guide discussions about what the data means. Giving students more detailed rubrics with formal expectations of the requirements of the assignments, particularly in the written format Find ways to increase student participation in class discussions. When this assignment has been utilized in previous semesters, students clearly displayed the capability to relate the co-curricular experiences in the data collection and its analysis to concepts and ideas covered during class. Evidence for this came from very dynamic and interactive class discussions based on air pollution as well as from the output of the written assignment, in which students were able to relate the nature, sources and chemical properties of the pollutants to their impact on the environment, health and society in general. LaGuardia's Core Competencies and Communication Abilities List the Program Goal(s) that this assignment targets Global Learning based on comparing pollutant levels around the LaGuardia campus with those in other locations or countries. It is also an IPS assignment, incorporating scientific literacy and thinking, as students need to analyze the data, interpret it and reflect on the outcomes. List the Student Learning Objective(s) that this assignment targets Identify and apply fundamental chemical concepts and methods. Gather, analyze, and interpret data. List the Course Objectives(s) that this assignment targets Explore the complex connections between chemistry and society. Apply chemical principles to real world issues, including ethical aspects. Gather, analyze, and interpret data. Write a short description of the pedagogy involved in executing this assignment Students collect and analyze the data, interpret the results in terms of pollution levels, safety and ethics and compare with EPA standard levels and with levels in other countries. Outside the classroom events will be organized for data collection. There will be class and group-based discussions focused on the data, its analysis and the connections to society.
This problem illustrates how numerical theories are developed, how we might test …
This problem illustrates how numerical theories are developed, how we might test this theory with an analog model, and how numerical models are constructed and the limitations of numerical modeling.
(Note: this resource was added to OER Commons as part of a batch upload of over 2,200 records. If you notice an issue with the quality of the metadata, please let us know by using the 'report' button and we will flag it for consideration.)
Comparative planetary geology requires understanding how geological processes are affected by changes …
Comparative planetary geology requires understanding how geological processes are affected by changes in physical environment-each planet and moon provides an opportunity to refine our understanding of how physical geological processes operate. Volcanism is a great example of a major geological process highly susceptible to such variations. Students performing this exercise will constrain how "Amboy Crater" would look if the same eruption happened on the Moon and Mars. Part 1 of the exercise asks small groups to assess either the yield strength of the Amboy flows or the time required for the flow to travel a given distance. After discussion of the results, Part 2 asks students to characterize the dimensions of the same flow, if emplaced on Mars or the Moon (changing only gravitational acceleration), and the time required for it to form; they are asked to predict the outcome in advance. Part 3 uses "Erupt" freeware by Ken Wohletz to explore how gravity changes will affect cinder cone geometry; the model is tested first to see if it correctly predicts an Amboy-like geometry, and afterwards students are asked to brainstorm what other factors should also be modified to improve the accuracy of the simulation, and how these changes would be expected to affect the geomorphological outcome. Finally, Part 4 asks students to use simple ballistic equations, implemented via an online Applet (Stromboli), to constrain the launch angle and starting velocity for the eruption that formed Amboy Crater (modifications are supposedly underway to permit this applet to run with different values of gravitational acceleration and air resistance).
(Note: this resource was added to OER Commons as part of a batch upload of over 2,200 records. If you notice an issue with the quality of the metadata, please let us know by using the 'report' button and we will flag it for consideration.)
Esta guía práctica acompaña la serie de videos Poder estadístico y tamaño …
Esta guía práctica acompaña la serie de videos Poder estadístico y tamaño de muestra en R, de mi canal de YouTube Investigación Abierta, que recomiendo ver antes de leer este documento. Contiene una explicación general del análisis de poder estadístico y cálculo de tamaño de muestra, centrándose en el procedimiento para realizar análisis de poder y tamaños de muestra en jamovi y particularmente en R, usando los paquetes pwr (para diseños sencillos) y Superpower (para diseños factoriales más complejos). La sección dedicada a pwr está ampliamente basada en este video de Daniel S. Quintana (2019).
In this problem set students are given Rb/Sr and 87Sr/86Sr data for …
In this problem set students are given Rb/Sr and 87Sr/86Sr data for whole rock and mineral samples from three granitic intrusions in the Sierra Nevada. They use these data (in EXCEL) to calculate isochron ages and initial ages for the intrusions and then interpret their results. This problem is intended to teach some spreadsheet skills (linear regressions, graphing) as well as having them think about the use of radiogenic isotopes.
(Note: this resource was added to OER Commons as part of a batch upload of over 2,200 records. If you notice an issue with the quality of the metadata, please let us know by using the 'report' button and we will flag it for consideration.)
This lab exercise provides students with activities utilizing vector operations within the …
This lab exercise provides students with activities utilizing vector operations within the context of the atmospheric and oceanic environments.
(Note: this resource was added to OER Commons as part of a batch upload of over 2,200 records. If you notice an issue with the quality of the metadata, please let us know by using the 'report' button and we will flag it for consideration.)
I designed the course for graduate students who use statistics in their …
I designed the course for graduate students who use statistics in their research, plan to use statistics, or need to interpret statistical analyses performed by others. The primary audience are graduate students in the environmental sciences, but the course should benefit just about anyone who is in graduate school in the natural sciences. The course is not designed for those who want a simple overview of statistics; well learn by analyzing real data. This course or equivalent is required for UMB Biology and EEOS Ph.D. students. It is a recommended course for several of the intercampus graduate school of marine science program options.
The primary learning objective of this textbook is to introduce the reader …
The primary learning objective of this textbook is to introduce the reader to the fundamental statistical methods and basic analytical procedures associated with processing data in regard to healthcare research. It is intended that by working through the applications and practice problems, readers should be able to understand and apply some of the methods for developing, implementing, and applying healthcare statistic principles in research.
"The Art of the Probable" addresses the history of scientific ideas, in …
"The Art of the Probable" addresses the history of scientific ideas, in particular the emergence and development of mathematical probability. But it is neither meant to be a history of the exact sciences per se nor an annex to, say, the Course 6 curriculum in probability and statistics. Rather, our objective is to focus on the formal, thematic, and rhetorical features that imaginative literature shares with texts in the history of probability. These shared issues include (but are not limited to): the attempt to quantify or otherwise explain the presence of chance, risk, and contingency in everyday life; the deduction of causes for phenomena that are knowable only in their effects; and, above all, the question of what it means to think and act rationally in an uncertain world. Our course therefore aims to broaden students' appreciation for and understanding of how literature interacts with – both reflecting upon and contributing to – the scientific understanding of the world. We are just as centrally committed to encouraging students to regard imaginative literature as a unique contribution to knowledge in its own right, and to see literary works of art as objects that demand and richly repay close critical analysis. It is our hope that the course will serve students well if they elect to pursue further work in Literature or other discipline in SHASS, and also enrich or complement their understanding of probability and statistics in other scientific and engineering subjects they elect to take.
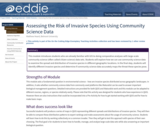
This module introduces students who are already familiar with GIS to doing …
This module introduces students who are already familiar with GIS to doing comparative analyses with large-scale community science (often called citizen science) data sets. Students will explore how we can use community science data to examine the spread and distribution of invasive species in different geographic locations. In the final step, students will identify different invasive species and determine if community science data accurately maps the threat these species pose.
(Note: this resource was added to OER Commons as part of a batch upload of over 2,200 records. If you notice an issue with the quality of the metadata, please let us know by using the 'report' button and we will flag it for consideration.)
Instruction on use of Fisher statistics to determine the mean and 95% …
Instruction on use of Fisher statistics to determine the mean and 95% confidence interval of geological vectors, lines or planes, with examples, problems and an Excel spreadsheet for computation.
(Note: this resource was added to OER Commons as part of a batch upload of over 2,200 records. If you notice an issue with the quality of the metadata, please let us know by using the 'report' button and we will flag it for consideration.)
In this homework assignment students are asked to consider the balance of …
In this homework assignment students are asked to consider the balance of forces on a hill slope using the Factor of Safety.
(Note: this resource was added to OER Commons as part of a batch upload of over 2,200 records. If you notice an issue with the quality of the metadata, please let us know by using the 'report' button and we will flag it for consideration.)
In Basic Engineering Data Collection and Analysis, Stephen B. Vardeman and J. …
In Basic Engineering Data Collection and Analysis, Stephen B. Vardeman and J. Marcus Jobe stress the practical over the theoretical. Step by step, students get real engineering data and scenario examples along with chapter-long case studies that illustrate concepts in realistic, thoroughly detailed situations. This approach encourages students to work through the material by carrying out data collection and analysis projects from problem formulation through the preparation of professional technical reports—just as if they were on the job.
This is an Excel spreadsheet and graph that illustrates standard "batch" and …
This is an Excel spreadsheet and graph that illustrates standard "batch" and Rayleigh decarbonation models and how they can be used to detect fluid infiltration during metamorphism of carbonates. It makes a good lecture demonstration, but with a few modifications can be turned into a laboratory exercise. Key variables are "hotlinked" directly into the batch and Rayleigh models so students can adjust them to get a feel for the influence of different model parameters. The included carbon isotope data are from marbles in the Jervois region, central Australia (Cartwright et al., 1997). Oxygen isotope data are also included in the spreadsheet.
(Note: this resource was added to OER Commons as part of a batch upload of over 2,200 records. If you notice an issue with the quality of the metadata, please let us know by using the 'report' button and we will flag it for consideration.)
Students are given the task of predicting where parasequence boundaries would exist …
Students are given the task of predicting where parasequence boundaries would exist within a vertical section of the Blackhawk Formation, Utah. This activity challenges students to apply their knowledge of bedforms in order to interpret the facies they observe. The students work in groups of two as they make their observations. The vertical section consists of four main outcrops to be observed by the students. After making their observations and interpretations of these four outcrops, the students then make predictions of what should be found up section. Students begin down section by observing the lowest section of the four outcrops. The students make observations about lithology, grain size, sedimentary structures and trace fossils. After recording their observations in their field notebook the class gathers for a discussion. Students are called on randomly to discuss what they observed. The class creates a group stratigraphic column on a white board and includes their observations to the right of the drawn profile. They are then asked to interpret what facies these observations represent. The students defend their interpretations and, as a group, agree upon an interpretation. The facies interpretation is then added to the white board and the group moves to the next outcrop up section. After observing, describing and interpreting each of the four outcrops the students are challenged to use all of the information gathered thus far to predict what facies should be observed further up section. This exercise provides an opportunity for the students to make and defend observations and interpretations. They also get a sense for the importance of Walther's Law and how it relates to sequence stratigraphy.
(Note: this resource was added to OER Commons as part of a batch upload of over 2,200 records. If you notice an issue with the quality of the metadata, please let us know by using the 'report' button and we will flag it for consideration.)
This resource consists of a Java applet and expository text. The applet …
This resource consists of a Java applet and expository text. The applet is a simulation of Bertrand's experiment: a random chord on a circle The event of interest is whether the length of the chord is larger than the length of the inscribed equilateral triangle. Three models for generating the random chord can be used.
This resource consists of a Java applet and expository text. The applet …
This resource consists of a Java applet and expository text. The applet illustrates Bayesian estimation of the probability of heads for a coin. The prior beta distribution, true probability of heads, and the sample size can be specified. The applet shows the posterior beta distribution.
This resource consists of a Java applet and expository text. The applet …
This resource consists of a Java applet and expository text. The applet simulates a random sample from a beta distribution, and computes standard point estimates of the left and right parameters. The bias and mean square error are also computed.
No restrictions on your remixing, redistributing, or making derivative works. Give credit to the author, as required.
Your remixing, redistributing, or making derivatives works comes with some restrictions, including how it is shared.
Your redistributing comes with some restrictions. Do not remix or make derivative works.
Most restrictive license type. Prohibits most uses, sharing, and any changes.
Copyrighted materials, available under Fair Use and the TEACH Act for US-based educators, or other custom arrangements. Go to the resource provider to see their individual restrictions.

![Air Pollution [Liberal Arts: Math and Science/Natural Science]](https://img.oercommons.org/160x134/oercommons/media/upload/materials/screenshots/materials-course-280650.png)