At the beginning of the course, each student is assigned a unique …
At the beginning of the course, each student is assigned a unique blob - or a piece of material of a particular shape with specific material properties (density, bulk modulus, composition, viscosity, volatile content, etc) that is residing within the mantle at a specific environment (depth, pressure, temperature). Then as the semester continues as a topic is covered the student must assess (either quantitatively or qualitatively) what observable would be associated with their blob (for example, gravity anomalies, geoid anomalies, surface expressions, seismic tomography, phase transition topography). The student then develops a portfolio of their blob and its observables to then present at the end of the course with an explanation/interpretation for the source of the blob culiminating at building a geo-story around their anomaly.
Some blobs could be amorphous anomalies whereas other could have physical significance (though best not to tell the students ahead of time so they can make their own discovery as to what the blob is or isn't) such as subducted slabs at the CMB (or 660 km), plumes, lithospheric drip, lithospheric root, or a boring typical piece of the mantle.
(Note: this resource was added to OER Commons as part of a batch upload of over 2,200 records. If you notice an issue with the quality of the metadata, please let us know by using the 'report' button and we will flag it for consideration.)
North American ecosystems have fundamentally changed over the late Pleistocene and Holocene; …
North American ecosystems have fundamentally changed over the late Pleistocene and Holocene; from a system dominated by mammoths, to bison, to domestic livestock. Given the very different body size and herd formation of these 'ecosystem engineers', it is likely that animals influence soil structure, water tables, vegetation and other animals in the ecosystems. What has been the ecological influence of the continued 'downsizing' of the largest animals in the ecosystem?
(Note: this resource was added to OER Commons as part of a batch upload of over 2,200 records. If you notice an issue with the quality of the metadata, please let us know by using the 'report' button and we will flag it for consideration.)
Using stereonets to find rotation axes of tilted planes. Paleomagnetic vectors used …
Using stereonets to find rotation axes of tilted planes. Paleomagnetic vectors used as indicators of rotations of dikes and planes.
(Note: this resource was added to OER Commons as part of a batch upload of over 2,200 records. If you notice an issue with the quality of the metadata, please let us know by using the 'report' button and we will flag it for consideration.)
This problem illustrates how numerical theories are developed, how we might test …
This problem illustrates how numerical theories are developed, how we might test this theory with an analog model, and how numerical models are constructed and the limitations of numerical modeling.
(Note: this resource was added to OER Commons as part of a batch upload of over 2,200 records. If you notice an issue with the quality of the metadata, please let us know by using the 'report' button and we will flag it for consideration.)
Comparative planetary geology requires understanding how geological processes are affected by changes …
Comparative planetary geology requires understanding how geological processes are affected by changes in physical environment-each planet and moon provides an opportunity to refine our understanding of how physical geological processes operate. Volcanism is a great example of a major geological process highly susceptible to such variations. Students performing this exercise will constrain how "Amboy Crater" would look if the same eruption happened on the Moon and Mars. Part 1 of the exercise asks small groups to assess either the yield strength of the Amboy flows or the time required for the flow to travel a given distance. After discussion of the results, Part 2 asks students to characterize the dimensions of the same flow, if emplaced on Mars or the Moon (changing only gravitational acceleration), and the time required for it to form; they are asked to predict the outcome in advance. Part 3 uses "Erupt" freeware by Ken Wohletz to explore how gravity changes will affect cinder cone geometry; the model is tested first to see if it correctly predicts an Amboy-like geometry, and afterwards students are asked to brainstorm what other factors should also be modified to improve the accuracy of the simulation, and how these changes would be expected to affect the geomorphological outcome. Finally, Part 4 asks students to use simple ballistic equations, implemented via an online Applet (Stromboli), to constrain the launch angle and starting velocity for the eruption that formed Amboy Crater (modifications are supposedly underway to permit this applet to run with different values of gravitational acceleration and air resistance).
(Note: this resource was added to OER Commons as part of a batch upload of over 2,200 records. If you notice an issue with the quality of the metadata, please let us know by using the 'report' button and we will flag it for consideration.)
In this problem set students are given Rb/Sr and 87Sr/86Sr data for …
In this problem set students are given Rb/Sr and 87Sr/86Sr data for whole rock and mineral samples from three granitic intrusions in the Sierra Nevada. They use these data (in EXCEL) to calculate isochron ages and initial ages for the intrusions and then interpret their results. This problem is intended to teach some spreadsheet skills (linear regressions, graphing) as well as having them think about the use of radiogenic isotopes.
(Note: this resource was added to OER Commons as part of a batch upload of over 2,200 records. If you notice an issue with the quality of the metadata, please let us know by using the 'report' button and we will flag it for consideration.)
This lab exercise provides students with activities utilizing vector operations within the …
This lab exercise provides students with activities utilizing vector operations within the context of the atmospheric and oceanic environments.
(Note: this resource was added to OER Commons as part of a batch upload of over 2,200 records. If you notice an issue with the quality of the metadata, please let us know by using the 'report' button and we will flag it for consideration.)
This module introduces students who are already familiar with GIS to doing …
This module introduces students who are already familiar with GIS to doing comparative analyses with large-scale community science (often called citizen science) data sets. Students will explore how we can use community science data to examine the spread and distribution of invasive species in different geographic locations. In the final step, students will identify different invasive species and determine if community science data accurately maps the threat these species pose.
(Note: this resource was added to OER Commons as part of a batch upload of over 2,200 records. If you notice an issue with the quality of the metadata, please let us know by using the 'report' button and we will flag it for consideration.)
Instruction on use of Fisher statistics to determine the mean and 95% …
Instruction on use of Fisher statistics to determine the mean and 95% confidence interval of geological vectors, lines or planes, with examples, problems and an Excel spreadsheet for computation.
(Note: this resource was added to OER Commons as part of a batch upload of over 2,200 records. If you notice an issue with the quality of the metadata, please let us know by using the 'report' button and we will flag it for consideration.)
In this homework assignment students are asked to consider the balance of …
In this homework assignment students are asked to consider the balance of forces on a hill slope using the Factor of Safety.
(Note: this resource was added to OER Commons as part of a batch upload of over 2,200 records. If you notice an issue with the quality of the metadata, please let us know by using the 'report' button and we will flag it for consideration.)
This is an Excel spreadsheet and graph that illustrates standard "batch" and …
This is an Excel spreadsheet and graph that illustrates standard "batch" and Rayleigh decarbonation models and how they can be used to detect fluid infiltration during metamorphism of carbonates. It makes a good lecture demonstration, but with a few modifications can be turned into a laboratory exercise. Key variables are "hotlinked" directly into the batch and Rayleigh models so students can adjust them to get a feel for the influence of different model parameters. The included carbon isotope data are from marbles in the Jervois region, central Australia (Cartwright et al., 1997). Oxygen isotope data are also included in the spreadsheet.
(Note: this resource was added to OER Commons as part of a batch upload of over 2,200 records. If you notice an issue with the quality of the metadata, please let us know by using the 'report' button and we will flag it for consideration.)
Students are given the task of predicting where parasequence boundaries would exist …
Students are given the task of predicting where parasequence boundaries would exist within a vertical section of the Blackhawk Formation, Utah. This activity challenges students to apply their knowledge of bedforms in order to interpret the facies they observe. The students work in groups of two as they make their observations. The vertical section consists of four main outcrops to be observed by the students. After making their observations and interpretations of these four outcrops, the students then make predictions of what should be found up section. Students begin down section by observing the lowest section of the four outcrops. The students make observations about lithology, grain size, sedimentary structures and trace fossils. After recording their observations in their field notebook the class gathers for a discussion. Students are called on randomly to discuss what they observed. The class creates a group stratigraphic column on a white board and includes their observations to the right of the drawn profile. They are then asked to interpret what facies these observations represent. The students defend their interpretations and, as a group, agree upon an interpretation. The facies interpretation is then added to the white board and the group moves to the next outcrop up section. After observing, describing and interpreting each of the four outcrops the students are challenged to use all of the information gathered thus far to predict what facies should be observed further up section. This exercise provides an opportunity for the students to make and defend observations and interpretations. They also get a sense for the importance of Walther's Law and how it relates to sequence stratigraphy.
(Note: this resource was added to OER Commons as part of a batch upload of over 2,200 records. If you notice an issue with the quality of the metadata, please let us know by using the 'report' button and we will flag it for consideration.)
Companion Site for Harvard Medical School Canvas Network MOOC Best Practices for …
Companion Site for Harvard Medical School Canvas Network MOOC Best Practices for Biomedical Research Data Management. This Open Science Framework project site includes all the materials contained in the Canvas course including: readings and resources; slide presentations; video lectures; activity outlines; research case studies and questions; and quiz questions with answer guide.
Biomedical research today is not only rigorous, innovative and insightful, it also …
Biomedical research today is not only rigorous, innovative and insightful, it also has to be organized and reproducible. With more capacity to create and store data, there is the challenge of making data discoverable, understandable, and reusable. Many funding agencies and journal publishers are requiring publication of relevant data to promote open science and reproducibility of research.
In order to meet to these requirements and evolving trends, researchers and information professionals will need the data management and curation knowledge and skills to support the access, reuse and preservation of data.
This course is designed to address present and future data management needs.
Preparation requires lecture and/or reading material on stereonet methods in plotting small …
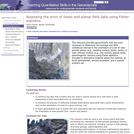
Preparation requires lecture and/or reading material on stereonet methods in plotting small circles, and on making stereonet rotations along small circles. In lab, students are given a description of the problem, along with a schematic cross section on the blackboard showing how the dip of the eastern fold limb is not constrained, but how the orientation of cross beds in an unoriented core are the only data available to help constrain the dip of the fold limb. Students are then given a while (~20 minutes) to think about and discuss how a solution can be made. An open class discussion follows, and then I guide the students through the answer. An alternative method is to let the students take a week to think about and solve the problem with little or no help.
(Note: this resource was added to OER Commons as part of a batch upload of over 2,200 records. If you notice an issue with the quality of the metadata, please let us know by using the 'report' button and we will flag it for consideration.)
Question Suppose that you are building a new house. It will take …
Question Suppose that you are building a new house. It will take about 90 kg (198 pounds) of copper to do the electrical wiring. In order to get the copper in the first place, someone needs to mine solid rock that contains copper, extract the copper minerals, throw away the waste rock, and smelt the copper minerals to produce copper metal. Rocks mined for copper typically contain only very small percentages of copper -- about 0.7% in the case of most of the big porphyry copper deposits of the world. How much rock would someone have to mine in order to extract enough copper to wire your new house?
(Note: this resource was added to OER Commons as part of a batch upload of over 2,200 records. If you notice an issue with the quality of the metadata, please let us know by using the 'report' button and we will flag it for consideration.)
Question In 1983, an eruption began at Kilauea Volcano in Hawaii that …
Question In 1983, an eruption began at Kilauea Volcano in Hawaii that has proved to be the largest and longest-lived eruption since records began in 1823. Lava has poured out of the volcano at an average rate of about 160 million m3 per year. To put those flow rates into perspective, let's suppose that the volcano was erupting directly into your classroom. At these flow rates, how long would it take to fill your classroom with lava?
(Note: this resource was added to OER Commons as part of a batch upload of over 2,200 records. If you notice an issue with the quality of the metadata, please let us know by using the 'report' button and we will flag it for consideration.)
SSAC Physical Volcanology module. Students build a spreadsheet and apply the ideal …
SSAC Physical Volcanology module. Students build a spreadsheet and apply the ideal gas law to model the velocity of a bubble rising in a viscous magma.
(Note: this resource was added to OER Commons as part of a batch upload of over 2,200 records. If you notice an issue with the quality of the metadata, please let us know by using the 'report' button and we will flag it for consideration.)
Lab 1: the students begin by describing on a worksheet their own …
Lab 1: the students begin by describing on a worksheet their own ideas of delta formation using concept sketches and written descriptions of the stages of formation, with only broad guidance from the instructor. They are also asked to describe the key features of their concept sketches, and to hypothesize how those features might develop (the processes). The students have all been exposed to deltas in Physical Geology, but likely only have rudimentary knowledge of them. Once they have completed the worksheet, the entire class moves to a lab with a stream table in it, preset to run a "model delta." The model has both a web cam and a time-lapse web cam set up over the table to record the development. The students help start the water flowing and the cameras recording, then watch as it develops over the next 2-3 days.
Lab 2: In the second lab, we use grain-size analysis of the stream-table delta as a means of testing some of their ideas from lab 1. The students as a class develop a strategy to sample the stream-table delta for grain size, using a laser grain-size analyzer. Each pair of students collect one sample, but are also asked to predict the changes in grain size distribution for samples elsewhere in the delta. The particle size analyzer rapidly provides results to the students near the end of lab.
Lab 3: the final lab is a field trip to a pair of gravel pits that expose the guts of two natural stranded deltas, including topset and foreset beds. The students are asked to assess the landforms on a topo map before arriving, and to describe the deposits at each site we visit. On the final writeup, the students need to synthesize all the elements of the three labs, along with input from our readings in the textbook (Easterbrook) and McPhee's "Control of Nature."Â
(Note: this resource was added to OER Commons as part of a batch upload of over 2,200 records. If you notice an issue with the quality of the metadata, please let us know by using the 'report' button and we will flag it for consideration.)
In this lab exercise, students examine one or more metamorphic rocks and …
In this lab exercise, students examine one or more metamorphic rocks and use various approaches to estimating and calculating the pressure-temperature conditions at which the rocks equilibrated. The exercise involves hand sample description, petrography, interpretation of phase diagrams, and calculations of a phase diagram or P-T conditions from given equations.
No restrictions on your remixing, redistributing, or making derivative works. Give credit to the author, as required.
Your remixing, redistributing, or making derivatives works comes with some restrictions, including how it is shared.
Your redistributing comes with some restrictions. Do not remix or make derivative works.
Most restrictive license type. Prohibits most uses, sharing, and any changes.
Copyrighted materials, available under Fair Use and the TEACH Act for US-based educators, or other custom arrangements. Go to the resource provider to see their individual restrictions.