Updating search results...

Search Resources

402 Results

View
Selected filters:
  • quantitative-reasoning
Case Study 2: The Salton Sea
Conditional Remix & Share Permitted
CC BY-NC-SA
Rating
0.0 stars

Compiled and modified for instructional use by: Lisa Phillips, Illinois State University, llphill@ilstu.edu
On September 10, 2012, several million southern California residents reacted with alarm to an unfamiliar noxious scent. The Air Quality Management District officials in the Los Angeles region were initially at a loss to determine the odor's source. Investigators from Ventura to Palm Springs looked for toxic spills, sewage plant leaks, and gas line breaks—all for naught.

The smell's origin was the Salton Sea more than 150 miles away and not usually upwind. The smell of an algal bloom and subsequent massive fish kill released odor molecules redolent with the stench of environmental decay.

This case study includes discussion questions and data sources for further information.

(Note: this resource was added to OER Commons as part of a batch upload of over 2,200 records. If you notice an issue with the quality of the metadata, please let us know by using the 'report' button and we will flag it for consideration.)

Subject:
Applied Science
Environmental Science
Material Type:
Activity/Lab
Case Study
Reading
Provider:
Science Education Resource Center (SERC) at Carleton College
Provider Set:
Teach the Earth
Author:
Lisa Phillips
Date Added:
02/15/2021
A Case Study: Geology, Remediation, Investigation at a RR Repair Shop Brownfield Site, St. Paul, Minnesota
Conditional Remix & Share Permitted
CC BY-NC-SA
Rating
0.0 stars

A case-study approach can be used to introduce students to the work that geologists do as environmental consultants. Data used by environmental consultants for a Brownfield site that is currently undergoing redevelopment in St. Paul, MN has been adapted for in-class study, either as a series of short exercises, or as part of a larger project.

(Note: this resource was added to OER Commons as part of a batch upload of over 2,200 records. If you notice an issue with the quality of the metadata, please let us know by using the 'report' button and we will flag it for consideration.)

Subject:
Chemistry
Mathematics
Measurement and Data
Physical Science
Statistics and Probability
Material Type:
Activity/Lab
Case Study
Provider:
Science Education Resource Center (SERC) at Carleton College
Provider Set:
Teach the Earth
Author:
Kate Kleiter
Date Added:
08/12/2019
Chemical Differentiation in the Palisades Sill
Conditional Remix & Share Permitted
CC BY-NC-SA
Rating
0.0 stars

The purpose of this assignment is for students to synthesize field observations, petrography, and whole-rock chemical analyses in order to investigate chemical differentiation processes in a basaltic magma chamber. The students first complete a petrography lab on both hand samples and thin sections that represent a complete stratigraphic section through sill at Fort Lee, NJ. I then provide them with major- and trace-element data and a table of distribution coefficients for common phases that would be crystallizing from basaltic magma. I then ask them to discuss the chemical differentiation of the sill by writing up a 1-2 page interpretative summary based on their petrographic observations and the chemical data.

(Note: this resource was added to OER Commons as part of a batch upload of over 2,200 records. If you notice an issue with the quality of the metadata, please let us know by using the 'report' button and we will flag it for consideration.)

Subject:
Biology
Chemistry
Life Science
Mathematics
Measurement and Data
Physical Science
Statistics and Probability
Material Type:
Activity/Lab
Data Set
Lesson Plan
Provider:
Science Education Resource Center (SERC) at Carleton College
Provider Set:
Teach the Earth
Author:
Matthew Gorring
Date Added:
08/06/2019
Climate as Constraint
Conditional Remix & Share Permitted
CC BY-NC-SA
Rating
0.0 stars

Introduction:
Groundwater is key to Texas future and economy. The resource has long been a focus of legislative and economic interest. In the earliest days, the resource was viewed as 'occult and hidden.' That sense of mystery remains even as groundwater becomes more critical to the water resource picture for the state.
Since 1951, the state conducts regional water planning with the involvement of citizen stakeholders. Let's use your science-based knowledge of groundwater flow to see if you can find the right balance for both protecting and planning for groundwater use.
Our Case:
This week we will evaluate a historic court case from June 13, 1904. The case of East versus Texas Central Railroad Company is the Texas Supreme Ruling that provides the foundation for Texas groundwater law -- Rule of Capture.
In the appendix, you will find the following figures to help you determine whether or not Mr. East's well was impacted by the railroad company's pumping:

Platt map showing well locations and possible distances
Schematics of the well dimensions, along with simplified subsurface geology in the area.

In addition, you will be interested in knowing that the Geologic Atlas of Texas shows that the wells were likely completed in the Pawpaw Formation, which is a thick calcareous clay unit in the lower sections and cemented sand in the upper part. Lithologies in the area are reported to yield limited to moderate amounts of water in shallow wells. You can expect that the formation was an unconfined unit and assume that the East well is down-gradient from the Railroad well.
Assignment Part One:

1. Using the information from our last lecture, what do you think a reasonable transmissivity rate might be for the Pawpaw formation?

a. Estimate a transmissvity for a cemented sand unit.
b. Use this value as your first estimate in calculations to calculate the potential drawdown with Jacob's equation. This calculates the drawdown in an nonleaky artesian aquifer, sa, given the observed water table drawdowns.

sa = swt -- (s2st/2m)

c. Calculate swt using a correction equation.

Swt = m-(m2-2msa)1/2

Where m is the initial saturated thickness, which you may estimate at 30 ft.

2. How much water do you estimate that the railroad can extract before the well is impacted? Complete a diagram showing estimated drawdown (ft) on the y-axis and distances from the Railroad well (ft) using different transmissivity values and different distances. What do you discover about the case?
3. With your hydrogeologic analysis, do you believe that the East well was impacted by the railroad well? Can you explain how significant the impact may or may not have been?

Climate Considerations:
Is it possible that climate conditions could have impacted conditions in the well? Visit the Greenleaf website ([greenleaf.unl.edu/downloads/scPDSI.zip]) and access data for Palmer Drought Severity Indices. Looking at this data, complete the next questions.
Assignment Part 2:

4. Looking at the drought severity index maps of Texas from October 1900 to September 1902. What kind of implications might climate conditions have had on the groundwater conditions?
5. If climate conditions worsened, what do you think would happen to the wells?

Reference:
Mace, R.E., Ridgeway, C., and Sharp, J.M., 2004, Groundwater is no longer secret and occult - A historical and hydrogeologic analysis of the East case, 100 Years of Rule of Capture: From East to Groundwater Management, ed. Mullican, W.F. and Schwarz, S., Report 361, Texas Water Development Board, 63-86 pp.
Appendix -- support documents:
Figure 1 shows that Mr. East lived in Denison County, TX. The inset is a plan view map showing the potential locations of the wells in the town.
(in supporting documents)
Figure 2: Schematic of well dimensions and simplified geology.
(In supporting documents)

(Note: this resource was added to OER Commons as part of a batch upload of over 2,200 records. If you notice an issue with the quality of the metadata, please let us know by using the 'report' button and we will flag it for consideration.)
Subject:
Biology
Hydrology
Life Science
Mathematics
Measurement and Data
Physical Science
Statistics and Probability
Material Type:
Activity/Lab
Provider:
Science Education Resource Center (SERC) at Carleton College
Provider Set:
Teach the Earth
Author:
Suzanne Pierce
Date Added:
08/29/2019
Comparing Carbon Calculators
Conditional Remix & Share Permitted
CC BY-NC-SA
Rating
0.0 stars

Carbon calculators, no matter how well intended as tools to help measure energy footprints, tend to be black boxes and can produce wildly different results, depending on the calculations used to weigh various energy factors. By comparing different calculators, learners can analyze which ones are the most accurate and relevant, and which are the most transparent.

(Note: this resource was added to OER Commons as part of a batch upload of over 2,200 records. If you notice an issue with the quality of the metadata, please let us know by using the 'report' button and we will flag it for consideration.)
Subject:
Applied Science
Environmental Science
Material Type:
Activity/Lab
Data Set
Lesson Plan
Provider:
Science Education Resource Center (SERC) at Carleton College
Provider Set:
Teach the Earth
Author:
Mark McCaffrey
Date Added:
11/04/2021
Comparing Climate Records from Multiple Locations
Conditional Remix & Share Permitted
CC BY-NC-SA
Rating
0.0 stars

This activity applies to Teaching Principle 2: Climate is regulated by complex interactions among components of the Earth System. It specifically addresses Concept 2A: Earth's climate is influenced by interactions involving the sun, ocean, atmosphere, clouds, ice, land, and life. Climate varies by region as a result of local differences in these interactions. It is anticipated that the activity will take two 50 - 75 minute class periods with additional time for follow-up assessment.
Students use web resources to identify climate patterns and distributions and
synthesize the information to develop an understanding of the global variation.

Students develop tables of temperature and precipitation averages and also identify and describe an extreme weather event. This exercise is an inquiry-style lesson and can easily be adapted for use in or out of the classroom.

Note: Prior to this assignment, students should receive some information on how to sample climate data from the GLOBE or NASA sets, or how to find quality online resources about climate and climate variability. This could be done as a walk-through, in-class tutorial of government/ university research centers and SERC sites, comparing the information in each to less reliable sources such as Wikipedia.

(Note: this resource was added to OER Commons as part of a batch upload of over 2,200 records. If you notice an issue with the quality of the metadata, please let us know by using the 'report' button and we will flag it for consideration.)
Subject:
Applied Science
Biology
Environmental Science
Life Science
Mathematics
Measurement and Data
Statistics and Probability
Material Type:
Activity/Lab
Provider:
Science Education Resource Center (SERC) at Carleton College
Provider Set:
Teach the Earth
Author:
Beth Christensen
Date Added:
09/15/2022
Comparing Stream Discharge in Two Watersheds in Glacier National Park
Conditional Remix & Share Permitted
CC BY-NC-SA
Rating
0.0 stars

Spreadsheets Across the Curriculum module/Geology of National Parks course. Students study how discharge per unit area varies with elevation in the high country of Glacier National Park from USGS hydrograph data from Swiftcurrent Creek and its tributary Grinnell Creek..

(Note: this resource was added to OER Commons as part of a batch upload of over 2,200 records. If you notice an issue with the quality of the metadata, please let us know by using the 'report' button and we will flag it for consideration.)
Subject:
Biology
Life Science
Mathematics
Measurement and Data
Statistics and Probability
Material Type:
Activity/Lab
Provider:
Science Education Resource Center (SERC) at Carleton College
Provider Set:
Teach the Earth
Author:
Module by: Mark Rains, University of South Florida Cover Page by: Len Vacher and Denise Davis, University of South Florida
Date Added:
12/29/2020
Comparison of GDP and the Human Development Index (HDI).
Conditional Remix & Share Permitted
CC BY-NC-SA
Rating
0.0 stars

This assignment exposes students to data on economic growth and development as commonly measured by per capita GDP and the Human Development Index (HDI) for 100 countries of the world. There is a big debate about how good an indicator HDI is compared to GDP per capita as a measure of development.

Subject:
Economics
Mathematics
Social Science
Material Type:
Activity/Lab
Homework/Assignment
Provider:
Science Education Resource Center (SERC) at Carleton College
Provider Set:
Quantitative Writing (SERC)
Author:
Meherun Ahmed
Date Added:
08/28/2012
Compositional Diversity in Volcanic Suites
Conditional Remix & Share Permitted
CC BY-NC-SA
Rating
0.0 stars

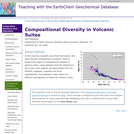
In this exercise, students use whole-rock major- and trace-element compositions of volcanic rocks to explore the origins of compositional variation in igneous suites. Large datasets from the Yellowstone and Crater Lake calderas are downloaded from the GEOROC database, imported into Excel spreadsheets, and graphed to learn about the different petrogeneses of these two volcanic suites.

(Note: this resource was added to OER Commons as part of a batch upload of over 2,200 records. If you notice an issue with the quality of the metadata, please let us know by using the 'report' button and we will flag it for consideration.)
Subject:
Biology
Chemistry
Geoscience
Life Science
Mathematics
Measurement and Data
Physical Science
Statistics and Probability
Material Type:
Activity/Lab
Data Set
Lesson Plan
Provider:
Science Education Resource Center (SERC) at Carleton College
Provider Set:
Teach the Earth
Author:
Kent Ratajeski
Date Added:
08/19/2020
Concepts in Statistics
Unrestricted Use
CC BY
Rating
0.0 stars

Using highly interactive learning design, this Concepts in Statistics course provides students with a strong understanding of fundamental principles that guide the study of statistical inference. Drawing from Open Learning Initiative (OLI) source content, this course’s simulations and lab-style synthesis activities invite hands-on exploration of statistical concepts. Students learn to summarize data graphically and numerically; examine relationships among quantitative data; understand the role of probability and probability distributions; link probability to statistical inference; and conduct foundational statistical calculations and analyses.

Subject:
Mathematics
Material Type:
Textbook
Author:
Lumen Learning
Date Added:
12/01/2020
Confirmation of the IPCC Prediction re: Increased Storminess
Conditional Remix & Share Permitted
CC BY-NC-SA
Rating
0.0 stars

This activity represents a culmination project for this unit by means of which students can assess whether the IPCC prediction of increased storminess as an outcome of global warming survives testing. For the previous three weeks students will have conducted several inquiry-based group activities designed to introduce and reinforce fundamental meteorology/climatology concepts. In this 2-day project, students access online AVHRR SST imagery, as well as tabulated numeric data regarding historical North American tropical cyclones, import data into Excel for interpretation and analysis, and submit two group reports.

(Note: this resource was added to OER Commons as part of a batch upload of over 2,200 records. If you notice an issue with the quality of the metadata, please let us know by using the 'report' button and we will flag it for consideration.)
Subject:
Applied Science
Biology
Environmental Science
Life Science
Mathematics
Measurement and Data
Oceanography
Physical Science
Statistics and Probability
Material Type:
Activity/Lab
Provider:
Science Education Resource Center (SERC) at Carleton College
Provider Set:
Teach the Earth
Author:
Robert Kuhlman
Date Added:
08/21/2020
Constructing a data-driven rainfall-runoff model
Conditional Remix & Share Permitted
CC BY-NC-SA
Rating
0.0 stars

The objective of this lesson is to introduce students to rainfall-runoff modeling using machine learning algorithms. In this lesson, students will walk through the process of accessing data, visualizing the data, statistically analyzing the data and using machine learning software packages to construct rainfall-runoff models.

(Note: this resource was added to OER Commons as part of a batch upload of over 2,200 records. If you notice an issue with the quality of the metadata, please let us know by using the 'report' button and we will flag it for consideration.)

Subject:
Biology
Life Science
Mathematics
Measurement and Data
Statistics and Probability
Material Type:
Activity/Lab
Lesson
Provider:
Science Education Resource Center (SERC) at Carleton College
Provider Set:
Teach the Earth
Author:
Tianfang Xu
Date Added:
12/22/2019
Continental Crust Mass Balance Calculation
Conditional Remix & Share Permitted
CC BY-NC-SA
Rating
0.0 stars

A quantitative skills-intensive exercise using data from the Mineral Mountains, Utah, to calculate mass balance and to address the "space problem" involved with emplacing plutons into the crust.

(Note: this resource was added to OER Commons as part of a batch upload of over 2,200 records. If you notice an issue with the quality of the metadata, please let us know by using the 'report' button and we will flag it for consideration.)
Subject:
Biology
Chemistry
Geology
Geoscience
Life Science
Mathematics
Measurement and Data
Physical Science
Statistics and Probability
Material Type:
Activity/Lab
Provider:
Science Education Resource Center (SERC) at Carleton College
Provider Set:
Teach the Earth
Author:
Jennifer Wenner
Date Added:
08/23/2019
Converging Tectonic Plates Demonstration
Conditional Remix & Share Permitted
CC BY-NC-SA
Rating
0.0 stars

During this demo, participants use springs and a map of the Pacific Northwest with GPS vectors to investigate the stresses and surface expression of subduction zones, specifically the Juan de Fuca plate diving beneath the North American plate.

(Note: this resource was added to OER Commons as part of a batch upload of over 2,200 records. If you notice an issue with the quality of the metadata, please let us know by using the 'report' button and we will flag it for consideration.)
Subject:
Biology
Life Science
Mathematics
Measurement and Data
Statistics and Probability
Material Type:
Activity/Lab
Homework/Assignment
Provider:
Science Education Resource Center (SERC) at Carleton College
Provider Set:
Teach the Earth
Author:
Shelley Olds
Date Added:
08/27/2022
Cost Effectiveness of Increased Fuel Efficiency
Conditional Remix & Share Permitted
CC BY-NC-SA
Rating
0.0 stars

In this example students examine and critique an argument which implies that it is not cost effective to pay for an automobile with increased fuel efficiency. Using a few reasonable assumptions shows that some of the writer's quantitative claims are not very accurate.

(Note: this resource was added to OER Commons as part of a batch upload of over 2,200 records. If you notice an issue with the quality of the metadata, please let us know by using the 'report' button and we will flag it for consideration.)
Subject:
Physical Science
Physics
Material Type:
Activity/Lab
Provider:
Science Education Resource Center (SERC) at Carleton College
Provider Set:
Teach the Earth
Author:
Stuart Boersma
Date Added:
09/23/2022
The Costs of Your Commute: Your Money, Your Time, and the Earth
Conditional Remix & Share Permitted
CC BY-NC-SA
Rating
0.0 stars

This activity has students investigate their own cost, CO2 output, and time for commuting. They then compare their commute to an environmentally conscious alternative by using comparable metrics.

(Note: this resource was added to OER Commons as part of a batch upload of over 2,200 records. If you notice an issue with the quality of the metadata, please let us know by using the 'report' button and we will flag it for consideration.)
Subject:
Applied Science
Biology
Environmental Science
Life Science
Mathematics
Measurement and Data
Statistics and Probability
Material Type:
Activity/Lab
Provider:
Science Education Resource Center (SERC) at Carleton College
Provider Set:
Teach the Earth
Author:
Charlie Buehrle
Date Added:
04/17/2018
Counting Grizzly Bears: An Exercise in Historical Reasoning
Conditional Remix & Share Permitted
CC BY-NC-SA
Rating
0.0 stars

This assignment engages students in an environmental history class in the use of quantitative data, and raises questions about the nature and meaning of that data, and how it might be utilized.

(Note: this resource was added to OER Commons as part of a batch upload of over 2,200 records. If you notice an issue with the quality of the metadata, please let us know by using the 'report' button and we will flag it for consideration.)

Subject:
Applied Science
Environmental Science
Material Type:
Activity/Lab
Provider:
Science Education Resource Center (SERC) at Carleton College
Provider Set:
Teach the Earth
Author:
George Vrtis
Date Added:
12/22/2019
Crystal Structures as Geobarometers
Conditional Remix & Share Permitted
CC BY-NC-SA
Rating
0.0 stars

This exercise is based on the recent formulation of a geobarometer based on the crystal structure of clinopyroxene (Nimis, 1995; 1998; 1999). This method relates structural parameters (e.g., the volumes of the unit cell and the M1 polyhedron) to the pressure at which the mineral crystallizes within basic and ultrabasic magmas.

In this exercise, students are guided into the American Mineralogist Crystal Structure Database to retrieve and download published crystal structure data for viewing in either the CrystalMaker or XtalDraw visualization software packages. The students are instructed on how to examine the structures to determine pressure-sensitive crystallographic parameters and are asked a series of questions related to what they learn.

(Note: this resource was added to OER Commons as part of a batch upload of over 2,200 records. If you notice an issue with the quality of the metadata, please let us know by using the 'report' button and we will flag it for consideration.)
Subject:
Chemistry
Geoscience
Mathematics
Measurement and Data
Physical Science
Statistics and Probability
Material Type:
Activity/Lab
Data Set
Diagram/Illustration
Interactive
Lesson Plan
Provider:
Science Education Resource Center (SERC) at Carleton College
Provider Set:
Teach the Earth
Author:
Kent Ratajeski
Date Added:
08/08/2019
Crystallization- Differentiation of Basaltic Magma
Conditional Remix & Share Permitted
CC BY-NC-SA
Rating
0.0 stars

In this exercise, students use major-element compositions of whole-rocks, volcanic glasses, and minerals in lavas and drill cores from the solidified Kilauea Iki lava lake. The data is presented in the form of a "precompiled" spreadsheet which contains selected analyses culled from the GEOROC database and a USGS Open File report. Students make graphs from the data to learn about the petrologic processes related to the eruption and in situ crystallization of basaltic magma

(Note: this resource was added to OER Commons as part of a batch upload of over 2,200 records. If you notice an issue with the quality of the metadata, please let us know by using the 'report' button and we will flag it for consideration.)
Subject:
Biology
Chemistry
Geoscience
Life Science
Mathematics
Measurement and Data
Physical Science
Statistics and Probability
Material Type:
Activity/Lab
Data Set
Interactive
Lesson Plan
Provider:
Science Education Resource Center (SERC) at Carleton College
Provider Set:
Teach the Earth
Author:
Kent Ratajeski
Date Added:
08/07/2019
Data Rich Economic Policy Brief
Conditional Remix & Share Permitted
CC BY-NC-SA
Rating
0.0 stars

This assignment asks students to write a data-rich policy brief, showing their ability to apply standard microeconomic models and contextualizing the policy debate with numeric evidence.

Subject:
Economics
Social Science
Material Type:
Activity/Lab
Provider:
Science Education Resource Center (SERC) at Carleton College
Provider Set:
Quantitative Writing (SERC)
Author:
Nathan Grawe
Date Added:
08/28/2012