Storms can have devastating impacts on coastal communities. Typically, tropical storms like …
Storms can have devastating impacts on coastal communities. Typically, tropical storms like hurricanes get the most attention, but there are other types of storms that occur at more northern latitudes that can be just as destructive. For example, in January of 2018, Winter Storm Grayson caused more than 300,000 power outages and $1.1 billion in damage, and resulted in 22 confirmed casualties along the eastern seaboard. In this module, students will learn how barometric pressure changes during a storm, analyze the effect of storms on oceanographic variables, classify a storm as a bomb cyclone, and compare a bomb cyclone to a hurricane. Ultimately students will use their quantitative reasoning skills to manipulate and visualize data during storms in the northeastern United States.
(Note: this resource was added to OER Commons as part of a batch upload of over 2,200 records. If you notice an issue with the quality of the metadata, please let us know by using the 'report' button and we will flag it for consideration.)
Question In many high-grade metamorphic belts around the world, rocks were buried …
Question In many high-grade metamorphic belts around the world, rocks were buried 20-30 km beneath the surface during deformation and metamorphism. How deep is that relative to the cruising altitude of a typical commercial airplane flying across the country?
(Note: this resource was added to OER Commons as part of a batch upload of over 2,200 records. If you notice an issue with the quality of the metadata, please let us know by using the 'report' button and we will flag it for consideration.)
Question Over the last 70 million years or so, the Hawaiian Hot …
Question Over the last 70 million years or so, the Hawaiian Hot Spot has been pumping out lava, a total of about 775,000 km3 worth. As the Pacific Plate has moved over the hot spot, the volcanic peaks and plateaus of the Hawaiian-Emperor seamount chain have formed. If all of that lava had erupted in California, how deeply would California be buried in lava?
(Note: this resource was added to OER Commons as part of a batch upload of over 2,200 records. If you notice an issue with the quality of the metadata, please let us know by using the 'report' button and we will flag it for consideration.)
Question Suppose that you are building a new house. It will take …
Question Suppose that you are building a new house. It will take about 90 kg (198 pounds) of copper to do the electrical wiring. In order to get the copper in the first place, someone needs to mine solid rock that contains copper, extract the copper minerals, throw away the waste rock, and smelt the copper minerals to produce copper metal. Rocks mined for copper typically contain only very small percentages of copper -- about 0.7% in the case of most of the big porphyry copper deposits of the world. How much rock would someone have to mine in order to extract enough copper to wire your new house?
(Note: this resource was added to OER Commons as part of a batch upload of over 2,200 records. If you notice an issue with the quality of the metadata, please let us know by using the 'report' button and we will flag it for consideration.)
Question In 1983, an eruption began at Kilauea Volcano in Hawaii that …
Question In 1983, an eruption began at Kilauea Volcano in Hawaii that has proved to be the largest and longest-lived eruption since records began in 1823. Lava has poured out of the volcano at an average rate of about 160 million m3 per year. To put those flow rates into perspective, let's suppose that the volcano was erupting directly into your classroom. At these flow rates, how long would it take to fill your classroom with lava?
(Note: this resource was added to OER Commons as part of a batch upload of over 2,200 records. If you notice an issue with the quality of the metadata, please let us know by using the 'report' button and we will flag it for consideration.)
Question Let's suppose that you have a shoe box full of water …
Question Let's suppose that you have a shoe box full of water (the box is waterproof, of course). The shoe box weighs about 9 kg (19.8 pounds). Suppose you emptied the box and filled it completely with rock (little or no air space). How much would it weigh? Let's empty the box again and fill it completely with pure gold. How much would the box weigh now?
(Note: this resource was added to OER Commons as part of a batch upload of over 2,200 records. If you notice an issue with the quality of the metadata, please let us know by using the 'report' button and we will flag it for consideration.)
SSAC Physical Volcanology module. Students build a spreadsheet and apply the ideal …
SSAC Physical Volcanology module. Students build a spreadsheet and apply the ideal gas law to model the velocity of a bubble rising in a viscous magma.
(Note: this resource was added to OER Commons as part of a batch upload of over 2,200 records. If you notice an issue with the quality of the metadata, please let us know by using the 'report' button and we will flag it for consideration.)
Building Oscillation Seismic Simulation, or BOSS, is an opportunity for learners to …
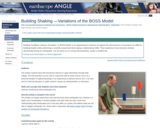
Building Oscillation Seismic Simulation, or BOSS, is an opportunity for learners to explore the phenomenon of resonance for different building heights while performing a scientific experiment that employs mathematical skills. They experience how structures behave dynamically during an earthquake.
(Note: this resource was added to OER Commons as part of a batch upload of over 2,200 records. If you notice an issue with the quality of the metadata, please let us know by using the 'report' button and we will flag it for consideration.)
IRIS (Incorporated Research Institutions for Seismology), FEMA (Federal Emergency Management Administration), ShakeAlert, Chris Hedeen (Oregon City High School), and ANGLE Project
Undergraduate student project for building datasets and analyzing the electoral, party system, …
Undergraduate student project for building datasets and analyzing the electoral, party system, and mass behavioral characteristics for a set of countries.
This is a very short exercise designed to get students to understand …
This is a very short exercise designed to get students to understand how the Gibbs energy equation is used to calculate the location of a reaction in P-T space. I use it in-class and have students work on it in groups.
Besides calculating the location of one reactions, students also have to think a bit about the significance of volume and entropy with regard to mineral stability.
This exercise is very straightforward EXCEPT that students get the units (bars, Kbar, cc, etc.) confused.
(Note: this resource was added to OER Commons as part of a batch upload of over 2,200 records. If you notice an issue with the quality of the metadata, please let us know by using the 'report' button and we will flag it for consideration.)
This example focuses on six letters to the editor. All six letters …
This example focuses on six letters to the editor. All six letters attempt to describe and compare the amount of taxes paid on two different incomes: $30,000 and $200,000. Tax rates are expressed in absolute dollars, tax per $1,000 of income, $1 of tax per income amount, and as percents of annual income. Students need to be able to organize the relevant information and convert each stated tax rate to a standard form to help make comparisons. Additionally, students need to be aware that letter writers may make their own mistakes!
In this lab activity, students learn about the relationships between sea level …
In this lab activity, students learn about the relationships between sea level and glaciers during glacial and interglacial periods. First the students need to calculate the maximum sea level rise assuming all water stored in glaciers and ice caps will melt. Then, they are asked to calculate the ice sheet distribution during the last glacial maxima based on the information that sea level dropped by 125 m.
(Note: this resource was added to OER Commons as part of a batch upload of over 2,200 records. If you notice an issue with the quality of the metadata, please let us know by using the 'report' button and we will flag it for consideration.)
Science students often have difficulty thinking about large spatial scales. The purpose …
Science students often have difficulty thinking about large spatial scales. The purpose of the exercise is to redo Eratosthenes' calculation of the radius of the Earth using data from to sites in ancient Egypt. The excercise teaches about the methodology of science - how Eratothenes figured it out - rather than worried about what the "right" answer is. It can also be used to discuss the role of models in geological thinking.
(Note: this resource was added to OER Commons as part of a batch upload of over 2,200 records. If you notice an issue with the quality of the metadata, please let us know by using the 'report' button and we will flag it for consideration.)
Project in which students calculate the magnitude of lunar and solar tidal …
Project in which students calculate the magnitude of lunar and solar tidal forces on the earth. They calculate the solar tidal effect relative to the lunar tidal effect and the relative solar tidal effect for spring-tide conditions.
(Note: this resource was added to OER Commons as part of a batch upload of over 2,200 records. If you notice an issue with the quality of the metadata, please let us know by using the 'report' button and we will flag it for consideration.)
Prior to assigning this activity in lecture, students gather information about their …
Prior to assigning this activity in lecture, students gather information about their personal energy consumption so that they can calculate their personal carbon footprint. Specifically they need to determine the gas mileage of their vehicle, the average number of miles they drive in a month, and bring to class an electric bill and a natural gas bill from their apartment. I provide the appropriate information for students living in dorms. Their task during the class period is to assemble this information and calculate how much carbon their activities are responsible for generating. Once this portion of the assignment is complete, they investigate options for reducing their carbon emissions and the costs of those options. The pros and cons of carbon-reduction strategies form the basis for the class discussion. Lastly, students are asked to brain storm a list of potential carbon sources that are not included in this simple exercise, such as the carbon required to make the things we buy (computers, edible dinosaurs, q-tips, etc.).
(Note: this resource was added to OER Commons as part of a batch upload of over 2,200 records. If you notice an issue with the quality of the metadata, please let us know by using the 'report' button and we will flag it for consideration.)
An activity where students make a geologic timeline from calculator tape. (Note: …
An activity where students make a geologic timeline from calculator tape.
(Note: this resource was added to OER Commons as part of a batch upload of over 2,200 records. If you notice an issue with the quality of the metadata, please let us know by using the 'report' button and we will flag it for consideration.)
Students are given an outline map of the campus with no scale …
Students are given an outline map of the campus with no scale indicated. They are to work in small groups to determine the scale. Although rules and tape measures are provided, students are given no instruction on how to best determine the scale and are tasked with devising their own methodology. Students write their scales on the blackboard and we finish the class with a discussion of their various methodologies, sources of error, and why there is some variation among their results.
(Note: this resource was added to OER Commons as part of a batch upload of over 2,200 records. If you notice an issue with the quality of the metadata, please let us know by using the 'report' button and we will flag it for consideration.)
Spreadsheets Across the Curriculum module. Students use allometric relationships to calculate tree …
Spreadsheets Across the Curriculum module. Students use allometric relationships to calculate tree mass from trunk diameter in a stand of trees in the Pacific Northwest.
(Note: this resource was added to OER Commons as part of a batch upload of over 2,200 records. If you notice an issue with the quality of the metadata, please let us know by using the 'report' button and we will flag it for consideration.)
Compiled and modified for instructional use by: Kate Darby, Western Washington University …
Compiled and modified for instructional use by: Kate Darby, Western Washington University In 1887, Robert Towne built a metals smelter two and a half miles northwest of El Paso, Texas, across the river from Ciudad Juarez in Mexico and across the state border from several small towns in New Mexico. The smelter, which processed metal ore from regional mines, was quickly acquired by ASARCO (American Smelting and Refining Company) and became an important visual and economic institution in the region. In 1967, following the mantra of environmental regulation at the time—"the solution to pollution is dilution"—ASARCO erected what was then the tallest smokestack in the world: an 828-foot structure visible from much of the region. While the facility provided jobs to many in the region and produced metals important for a range of manufacturing and consumer products, by the 1970s, residents and scientists began to question the other products from the smelter—especially heavy metals pollution.
This case study includes discussion questions and data sources for further information.
(Note: this resource was added to OER Commons as part of a batch upload of over 2,200 records. If you notice an issue with the quality of the metadata, please let us know by using the 'report' button and we will flag it for consideration.)
No restrictions on your remixing, redistributing, or making derivative works. Give credit to the author, as required.
Your remixing, redistributing, or making derivatives works comes with some restrictions, including how it is shared.
Your redistributing comes with some restrictions. Do not remix or make derivative works.
Most restrictive license type. Prohibits most uses, sharing, and any changes.
Copyrighted materials, available under Fair Use and the TEACH Act for US-based educators, or other custom arrangements. Go to the resource provider to see their individual restrictions.