This task addresses many standards regarding the description and analysis of bivariate …
This task addresses many standards regarding the description and analysis of bivariate quantitative data, including regression and correlation. Students should recognize that the pattern shown is one of a strong, positive, linear association, and thus a correlation coefficient value near +1 is plausible. Students should also be able to interpret the slope of the least-squares line as an estimated increase in y per unit change in x (and thus for a 3 unit increase in x, students should expect an estimated increase in y that equals 3 times the model's slope value).
This task examines, from a mathematical and statistical point of view, how …
This task examines, from a mathematical and statistical point of view, how scientists measure the age of organic materials by measuring the ratio of Carbon 14 to Carbon 12. The focus here is on the statistical nature of such dating. This task addresses a very important issue about precision in reporting and understanding statements in a realistic scientific context.
In this task, output is given from a computer-generated simulation, generating size-100 …
In this task, output is given from a computer-generated simulation, generating size-100 samples of data from an assumed school population of 2000 students under hypotheses about the true distribution of yes/no voters.
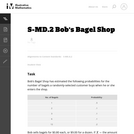
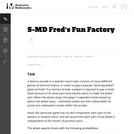
The purpose of this task is to assess a student's ability to …
The purpose of this task is to assess a student's ability to compute and interpret an expected value. Notice that interpreting expected value requires thinking in terms of a long-run average.
Using this lesson worksheet, computers and a simple programming interface, students step …
Using this lesson worksheet, computers and a simple programming interface, students step through and build a simple program to sequentially calculate all of the variables in the Hardy Weinberg equations. By building the program in sequence it is hoped that students will learn the sequence to solve a Hardy Weinberg problem and appreciate the value and power of computer number crunching capabilities as well as sequential programming considerations.
By building a program to determine the valence of ANY element on …
By building a program to determine the valence of ANY element on the first three rows of the Periodic table, students learn the steps to solve the problem while learning how to program logic and think about processing data in sequence. NOTE: The worksheet includes the option of letting students create a bug that they have to fix.
This professional development article identifies resources that show young learners (K-grade 5) …
This professional development article identifies resources that show young learners (K-grade 5) how scientists study Earth's climate and make predictions. The online lessons either allow students to collect and analyze data or learn about tools and technologies that make data collection possible. The lessons are aligned with national content standards for science education. The article appears in the free, online magazine Beyond Weather and the Water Cycle, which examines the recognized essential principles of climate literacy and the climate sciences for elementary teachers and their students.
The lessons posted on this site were designed to engage students with …
The lessons posted on this site were designed to engage students with real-world data relevant to content taught in middle school and high school science courses, and to foster an understanding of ways in which they might gather organize, analyze and interpret the data in order to draw scientifically valid inferences, interpretations and conclusions. Most of the labs use computer-based technology of spreadsheet programs or the Python programming interface. The Python lessons guide students in computational thinking to create simple programs to manipulate data. The lessons also provide students (and teachers) with instructions and guidance in the use of these technologies. Teacher and Student worksheets, as well as any supporting files, are linked to from links at the top of each lesson webpage as well as from the downloads page ("downloads" link on the scrolling menu to the left).
This task requires students to use the normal distribution as a model …
This task requires students to use the normal distribution as a model for a data distribution. Students must use given means and standard deviations to approximate population percentages. There are several ways (tables, graphing calculators, or statistical software) that students might calculate the required normal percentages. Depending on the method used, answers might vary somewhat from those shown in the solution.
This article provides background information that will help teachers present the science …
This article provides background information that will help teachers present the science associated with the study of climate, past, present and future. The magazine Beyond Weather and the Water Cycle is structured around the recognized principles of climate literacy. The author explains the science concepts included in the principle related to climate study and research and also identifies additional sources of information.
This list of carefully selected books for grades K-5 highlights nonfiction about …
This list of carefully selected books for grades K-5 highlights nonfiction about climate proxies, those preserved physical characteristics, such as fossils, that scientists use to reconstruct past climates. Also highlighted are a few books that provide information about two past climatic events -- the last ice age and the Dust Bowl. In each issue of the free, online magazine Beyond Weather and the Water Cycle, the virtual bookshelf recommends books that accurately portray the theme drawn from the principles of climate sciences.
Students create a spreadsheet (or use the one provided) to gather planet …
Students create a spreadsheet (or use the one provided) to gather planet data and put in categories. They massage spreadsheet to tease out relationship between distance from sun and revolution speed. They use data to predict speed and/or distance for Ceres, the new dwarf planet between Mars and Jupiter.
This is a simple task addressing the distinction between correlation and causation. …
This is a simple task addressing the distinction between correlation and causation. Students are given information indicating a correlation between two variables, and are asked to reason out whether or not a causation can be inferred. The task would be well-suited either as an introduction to this distinction, or as an assessment item.
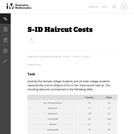
This problem could be used as an introductory lesson to introduce group …
This problem could be used as an introductory lesson to introduce group comparisons and to engage students in a question they may find amusing and interesting. More generally, the idea of the lesson could be used as a template for a project where students develop a questionnaire, sample students at their school and report on their findings.
No restrictions on your remixing, redistributing, or making derivative works. Give credit to the author, as required.
Your remixing, redistributing, or making derivatives works comes with some restrictions, including how it is shared.
Your redistributing comes with some restrictions. Do not remix or make derivative works.
Most restrictive license type. Prohibits most uses, sharing, and any changes.
Copyrighted materials, available under Fair Use and the TEACH Act for US-based educators, or other custom arrangements. Go to the resource provider to see their individual restrictions.