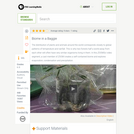
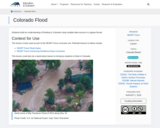
An exercise on the effects of flooding that took place in the …
An exercise on the effects of flooding that took place in the upper Mississippi River drainage basin in 1993, using before and after satellite images.
(Note: this resource was added to OER Commons as part of a batch upload of over 2,200 records. If you notice an issue with the quality of the metadata, please let us know by using the 'report' button and we will flag it for consideration.)
This resource is a video abstract of a research paper created by …
This resource is a video abstract of a research paper created by Research Square on behalf of its authors. It provides a synopsis that's easy to understand, and can be used to introduce the topics it covers to students, researchers, and the general public. The video's transcript is also provided in full, with a portion provided below for preview:
"Climate change is altering our world as we know it. Unfortunately, there’s no one-size-fits-all solution for making our environment resilient. From planners to scientists to farmers and ranchers, the lens through which climate change is viewed is dynamic. So how can anyone plan the best course of action with the best available data? Researchers led by Aavudai Anandhi at Florida A&M University might have just the right tool for the job. Their evidence-based approach combines three climate research methods to tailor action plans to the needs of a given ecosystem—whether that’s an entire country or state, or a single community, and whether for now or for the future. The approach begins with gathering evidence of climate change over a geographical region—the state of Florida for example. That’s done by pulling from trusted research to understand how factors like temperature or rainfall have evolved or are projected to evolve over time..."
The rest of the transcript, along with a link to the research itself, is available on the resource itself.
This resource is a video abstract of a research paper created by …
This resource is a video abstract of a research paper created by Research Square on behalf of its authors. It provides a synopsis that's easy to understand, and can be used to introduce the topics it covers to students, researchers, and the general public. The video's transcript is also provided in full, with a portion provided below for preview:
"Climate change is altering our world as we know it Despite general guidelines for mitigating harmful changes Climate change affects different areas in different ways And those effects aren’t always clear Now, a new evidence-based tool could provide the resolution to tailor plans of action around the globe It starts with a meta-analysis that gathers climate change data for a given ecosystem That data provides the input needed to draw conclusions about future climate trends, or scenarios Such as increases or decreases in temperature The effects those changes are likely to set in motion are then linked together in a causal chain Which can reveal how crops, natural resources, or animal species will fare amid climate change Although the tool becomes limited when data for a given area are scarce It could be a powerful new way to develop custom-made plans for fighting climate change.."
The rest of the transcript, along with a link to the research itself, is available on the resource itself.
In this middle school and high school unit, students engage with 360° …
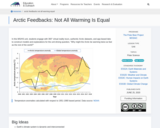
In this middle school and high school unit, students engage with 360° virtual reality tours, authentic Arctic datasets, and app-based labs to construct models and explanations for the unit driving question, "Why might the Arctic be warming twice as fast as the rest of the world?"
This activity is a scientific investigation focusing on inquiry after using the …
This activity is a scientific investigation focusing on inquiry after using the Foss Water Kit. The students will pose a question, create a procedure and produce a poster showing their findings.
In this assignment students receive six air photos of a 4 km …
In this assignment students receive six air photos of a 4 km stretch of Fountain Creek in El Paso Country, Colorado (38.7 N, 104.715 W) taken between 1989 and 2006 and are asked to evaluate and discuss how Fountain Creek has changed through the years. The main nuts and bolts of the assignment are an analysis of these repeat air photos and production of a map that depicts how the course of the river (or its cut-banks, point bars and bank-to-bank width) changes through time. To make this map, students can use trace paper/Mylar, or software such as ArcGIS or Adobe Photoshop or Illustrator, but whatever their method they use they need to be able to establish a scale allowing them to measure and calculate rates of change. What change to quantify is purposely left open ended - students typically focus on measuring rates of cut-bank erosion, point bar migration, bank-to-bank width changes, channel length or sinuosity variation over the prescribed study area - and is usually linked directly to what they decide to map, such as the course of the river or the extent of the 'active' channel. After producing their map and making measurements, the final part of the assignment is synthesis. In the final questions, students are asked to summarize and describe in words what's happening to the channel through time, with reference to their map and calculations, and to consider the environmental conditions that are driving the changes observed.
(Note: this resource was added to OER Commons as part of a batch upload of over 2,200 records. If you notice an issue with the quality of the metadata, please let us know by using the 'report' button and we will flag it for consideration.)
This unit exposes students to basic concepts of hydrology, like the hydrological …
This unit exposes students to basic concepts of hydrology, like the hydrological cycle, water budget of a river and chemistry of carbon in freshwaters. Students will explore and study the components of the hydrological cycle, the factors that influence this cycle, investigate the water budget equation and compare and contrast two watersheds that have similar overall amount of precipitation, but differ in terms of temperature and climate.
Students will also learn about pollutants in fresh waters, pH and pOH of water and its influence on the ecosystem, chemistry of carbon and heavy metals and how does a sewage treatment plant work. As a part of their curriculum, a field trip to a local sewage treatment plant is highly recommended for students and teachers.
Each lesson will be accompanied by a lesson plan. Depending on lesson, also included will be examples and applications (problems to be solved by students using concepts presented in the lesson).
The unit is intended to be taught in 10th or 11th grade Physical and Environmental Science classes, but it can be used also by middle school 7th and 8th grade Science teachers to expose students to concepts related to physical, chemical properties of water, states of matter, physical and chemical change, water cycle and basic geology.
This unit consists of seven distinct activities that teach climate change, the …
This unit consists of seven distinct activities that teach climate change, the water cycle, and the effects of the changing climate on water resources through the use of games, science experiments, investigations, role-playing, research, and creating a final project to showcase learning.
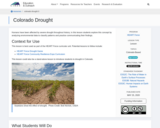
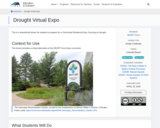
Humans have been affected by severe drought throughout history; in this lesson …
Humans have been affected by severe drought throughout history; in this lesson students explore this concept by analyzing environmental data to classify patterns and practice communicating their findings.
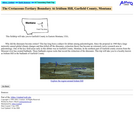
The goal of this virtual field trip to Iridium Hill, Montana is …
The goal of this virtual field trip to Iridium Hill, Montana is to investigate the disappearance of dinosaur fossils above the Cretaceous/ Tertiary boundary. The site provides rock outcrop photos of Cretaceous and Tertiary strata (Hell Creek and Fort Union Formations), stratigraphic sections and supporting text for this classic iridium-bearing locality. Topics include the K/T boundary, iridium concentrations, stratigraphy, sedimentology and, fluvial and lacustrine depositional environments.
This activity requires students to process, interpret and integrate a wide variety …
This activity requires students to process, interpret and integrate a wide variety of remote sensing and other data as they investigate a complex, open-ended research question. It is hands-on, collaborative, and manageable for a variety of class sizes. The problem addressed has geological, hydrological, biological and political implications, and is thus of interest to a wide array of undergraduates.
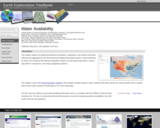
DATA: North American Regional Reanalysis (NARR). TOOL: FieldScope GIS. SUMMARY: Use an …
DATA: North American Regional Reanalysis (NARR). TOOL: FieldScope GIS. SUMMARY: Use an online GIS from the National Geographic Society, to investigate the relationship between precipitation, evaporation, and surface runoff.
(Note: this resource was added to OER Commons as part of a batch upload of over 2,200 records. If you notice an issue with the quality of the metadata, please let us know by using the 'report' button and we will flag it for consideration.)
Students will learn about magnification and how a magnifying lens works. They …
Students will learn about magnification and how a magnifying lens works. They will examine a variety of different objects, first without a magnifier and then with a magnifier, and compare what they observe. They will practice observing details of these objects with magnifying lens. The purpose of this activity is for students to learn about observation skills and how tools can help people make observations, what "magnification" means, and to learn that scientists use tools, such as magnifying lenses, to examine objects. Students will be able to identify a magnifying glass and its purposes. They will be able to describe how the same object looks different when using the unaided eye versus a magnifying lens.
Students will use various objects in the classroom to experiment with nonstandard …
Students will use various objects in the classroom to experiment with nonstandard measurement. They will make estimates and test them out. Then, working in pairs or small groups, students will use a ruler or a measuring tape to become familiar with how to use these tools for standard linear measurement. The purpose of this activity is to practice making standard and non-standard measurement and to learn the purpose of making linear measurements and how to apply them to scientific investigations. Students will learn how to make measurements, both nonstandard and standard (with a ruler). They will test their estimates and record their results.
Students learn about the water cycle and hydrology through a series of …
Students learn about the water cycle and hydrology through a series of three lessons, two coloring book pages, and an e-Book. The themes covered in this resource tie into Climate Science and fundamental climate principles, as well as, engages students in scientific methods.
No restrictions on your remixing, redistributing, or making derivative works. Give credit to the author, as required.
Your remixing, redistributing, or making derivatives works comes with some restrictions, including how it is shared.
Your redistributing comes with some restrictions. Do not remix or make derivative works.
Most restrictive license type. Prohibits most uses, sharing, and any changes.
Copyrighted materials, available under Fair Use and the TEACH Act for US-based educators, or other custom arrangements. Go to the resource provider to see their individual restrictions.