Updating search results...

Search Resources

20 Results

View
Selected filters:
  • forecasting
Backyard Weather Station
Read the Fine Print
Educational Use
Rating
0.0 stars

Students use their senses to describe what the weather is doing and predict what it might do next. After gaining a basic understanding of weather patterns, students act as state park engineers and design/build "backyard weather stations" to gather data to make actual weather forecasts.

Subject:
Applied Science
Atmospheric Science
Engineering
Physical Science
Material Type:
Activity/Lab
Provider:
TeachEngineering
Provider Set:
TeachEngineering
Author:
Janet Yowell
Lauren Cooper
Malinda Schaefer Zarske
Date Added:
10/14/2015
Climate Outlooks Increase Farmer's Odds for Success
Unrestricted Use
Public Domain
Rating
0.0 stars

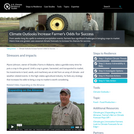
From weeks-long dry spells to extreme precipitation events, farmers face significant challenges in bringing crops to market. Here’s how one grower uses seasonal climate forecasts to increase his chances for success.

Subject:
Atmospheric Science
Physical Science
Material Type:
Case Study
Provider:
National Oceanic and Atmospheric Administration
Provider Set:
U.S. Climate Resilience Toolkit
Date Added:
08/09/2016
Comparative Land Use and Transportation Planning
Conditional Remix & Share Permitted
CC BY-NC-SA
Rating
0.0 stars

This course focuses on the land use-transportation "interaction space" in metropolitan settings. The course aims to develop an understanding of relevant theories and analytical techniques, through the exploration of various cases drawn from different parts of the world. The course begins with an overview of the role of transportation in patterns of urban development and metropolitan growth. It introduces the concept of accessibility and related issues of individual and firm travel demand. Later in the semester, students will explore the influence of the metropolitan built environment on travel behavior and the role of transportation on metropolitan land development. The course will conclude with an examination of the implications of the land use-transportation interaction space for metropolitan futures, and our abilities to forecast them.

Subject:
Social Science
Material Type:
Full Course
Provider:
MIT
Provider Set:
MIT OpenCourseWare
Author:
Zegras, Pericles
Date Added:
02/01/2006
Daisyworld: Stella Mac or PC
Conditional Remix & Share Permitted
CC BY-NC-SA
Rating
0.0 stars

After constructing a Stella model of Daisyworld students perform guided experiments to explore the behavior of Daisyworld to changes in model parameters and assumptions.

(Note: this resource was added to OER Commons as part of a batch upload of over 2,200 records. If you notice an issue with the quality of the metadata, please let us know by using the 'report' button and we will flag it for consideration.)

Subject:
Applied Science
Biology
Environmental Science
Life Science
Mathematics
Statistics and Probability
Material Type:
Activity/Lab
Provider:
Science Education Resource Center (SERC) at Carleton College
Provider Set:
Teach the Earth
Author:
Mike Clark
Date Added:
09/29/2022
Earth Exploration Toolbook Chapter: Exploring and Animating GOES Images
Conditional Remix & Share Permitted
CC BY-NC-SA
Rating
0.0 stars

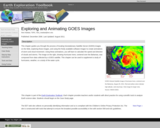
DATA: GOES Weather Images. TOOL: ImageJ. SUMMARY: Transform a time series of GOES images into an animation. Plot a storm track and determine storm speed.

(Note: this resource was added to OER Commons as part of a batch upload of over 2,200 records. If you notice an issue with the quality of the metadata, please let us know by using the 'report' button and we will flag it for consideration.)

Subject:
Atmospheric Science
Biology
Life Science
Physical Science
Material Type:
Activity/Lab
Data Set
Diagram/Illustration
Interactive
Lesson Plan
Provider:
Science Education Resource Center (SERC) at Carleton College
Provider Set:
Teach the Earth
Author:
Nick Haddad
Date Added:
04/13/2021
Entrepreneurial Sales
Conditional Remix & Share Permitted
CC BY-NC-SA
Rating
0.0 stars

This course outlines the practical and tactical ins and outs of how to sell technical products to a sophisticated marketplace. How to build and manage a sales force; building compensation systems for a sales force, assigning territories, resolving disputes, and dealing with channel conflicts. Focus on selling to customers, whether through a direct salesforce, a channel salesforce, or building an OEM relationship.

Subject:
Business and Communication
Management
Marketing
Material Type:
Full Course
Provider:
MIT
Provider Set:
MIT OpenCourseWare
Author:
Arnold, Kirk
Hoffman, Dennis
Shipley, Lou
Date Added:
02/01/2015
Forecasting Lake Effect Snow in Lake Superior region
Conditional Remix & Share Permitted
CC BY-NC-SA
Rating
0.0 stars

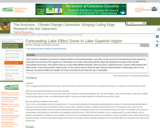
This exercise is designed to present the realistic problems of forecasting weather. Lake effect snows are hard to forecast because they depend on information that isn't part of the regular set of information and involve some pretty specific things that integrate the location of the site with surrounding environment. Even places close by can get totally different forecasts. When you have a regional forecast, it doesn't really address lake effect snows, unless the forecaster really focuses. So the exercise aims to show the value of broad critical thinking in meteorology, and it is very dramatic, because the difference between 36 inches and whiteout and clear blue sky is undeniable. The exercise comes when students are 8 weeks into the class. The class is an AMS based class, which has already been described well in this workshop by Julie Snow from Slippery Rock. Our class is given in the fall semester and lake effect snow starts in October and is quite an issue in forecasts until April. The skills of a forecaster are tested, and you cannot use forecasts from nearby areas reliably. Finally, we live in a fantastic snow belt, so lake effect snow happens a lot. In a good year we get over 300 inches of snow, mostly at times that places nearby do not. You can drive to Houghton in the bright sun and be met by a wall of very active blizzard just a few miles out of town.

There are some excellent tutorials available from COMET, and outreach of the National Weather Service. I use one done by Greg Byrd, which is available online or in a power point format. There are a number of things that must be learned before forecasting. These include some fluid dynamics of plumes, latent heat, remote sensing, upper air mapping, and the use of models. We cannot cover all them completely. I try to introduce all these things and give people entry points into the juicy parts of these topics, but do not expect students to understand completely. One thing you can spend a long time on are the satellite images. Here is one, just to whet your interest: http://serc.carleton.edu/details/images/13586.html


I have the students make a list of the critical parameters they think might be needed for a successful lake effect forecast. This is a challenge to prepare, but the idea is to include things that are even marginally useful and to collect data to see what is most important. We get a list of parameters like this:


850 mb wind direction
850 mb temperature
Lake Superior surface temperature
fetch length
opposing bay?
Inversion layer height
topographic lift factor
wind shear evidence
upstream lake
upstream moisture factor
snow/ice cover issues


This list is pretty good, but deliberately not complete, and we encourage students to add other things they think might be important. The next step is to find where you can get this information. I have web data sources for most (see below), and some of them are interrelated. You can do this exercise for any site around Lake Superior or probably many other lakes as well. For specific sites, the fetch length, upstream lake and opposing bay information are obtainable directly from the wind direction if you have a good map (Google Earth). So a spreadsheet for parameters related to wind direction can be prepared in advance and these parameters can be immediately available from the wind direction. Nonetheless the issue of sources for all this stuff must be addressed in an effort that spans several hours. The use of models is needed to look into the future where possible.

Once students know what they are looking for and how to find it, the exercise starts its data collection. Every day or every 6 or 12 hours beginning when conditions get close to "LES favorable" students collect information on these LES predictors. They also make LES forecasts for each period and include that information in the spreadsheet. The next day the real snowfall data is added to the spreadsheet, and this can be used as validation data for the forecast. This data collection needs to be done for several weeks (November and December in my case, usually a good time for LES).

The data analysis is the most challenging part. Spreadsheet plots which test the sensitivity of various parameters singly and together are possible. There is a lot of sophistication possible if there is enough LES to analyze. Overall, results should be a good experience with imperfect data addressed to a real-time problem. Models and real data, remote sensing, and balloons are all integrated and there are quite obvious weaknesses.

On the final day of class student groups will compete by doing forecasting which employs the LES techniques. This might reflect the most recent snow event. A more important element of this submission will be their evaluation of LES prediction parameters. Not only do we consider the actual forecast, but we discuss which parameters were successful? Which are inconclusive? What suggestions for improved forecasts are possible from the experience? The format of this will be short presentations with time for discussion.

(Note: this resource was added to OER Commons as part of a batch upload of over 2,200 records. If you notice an issue with the quality of the metadata, please let us know by using the 'report' button and we will flag it for consideration.)
Subject:
Applied Science
Atmospheric Science
Biology
Environmental Science
Life Science
Mathematics
Measurement and Data
Physical Science
Material Type:
Activity/Lab
Provider:
Science Education Resource Center (SERC) at Carleton College
Provider Set:
Teach the Earth
Author:
Bill Rose
Date Added:
08/24/2019
Forecasting Volcanic Eruptions
Read the Fine Print
Educational Use
Rating
0.0 stars

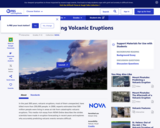
This media-rich essay from NOVA Online describes the challenges of forecasting volcanic eruptions and includes information about specific cases.

Subject:
Astronomy
Chemistry
Education
Geology
Geoscience
Physical Science
Physics
Space Science
Material Type:
Activity/Lab
Diagram/Illustration
Interactive
Provider:
PBS LearningMedia
Provider Set:
PBS Learning Media: Multimedia Resources for the Classroom and Professional Development
Author:
National Science Foundation
WGBH Educational Foundation
Date Added:
12/17/2005
How Predictable!
Read the Fine Print
Educational Use
Rating
0.0 stars

Students follow weather forecasts to gauge their accuracy and produce a weather report for the class. They develop skills of observation, recording and reporting.

Subject:
Applied Science
Atmospheric Science
Engineering
Physical Science
Material Type:
Activity/Lab
Provider:
TeachEngineering
Provider Set:
TeachEngineering
Author:
Denise Carlson
Jane Evenson
Malinda Schaefer Zarske
Date Added:
10/14/2015
Hurricane Tracking
Conditional Remix & Share Permitted
CC BY-NC-SA
Rating
0.0 stars

This homework assignment is given in the first two weeks of class. Students receive one or two lectures that cover the topics of atmospheric layers, temperature and pressure profiles, concepts of atmospheric mass and pressure and measuring (i.e. dropsonde) instrumentation. At the beginning of each lecture I briefly show them the tropical update from the NOAA National Hurricane Center web site; if there is an active storm, I show where I go to get more info, such as the projected storm track and storm history (for example, from Intellicast Hurricane Tracking). Then, for this assignment, I reintroduce them to these hurricane information web sites and demonstrate how to find the historical data on tropical storms (such as from the Unisys Hurricane Data Archive), and how to copy and paste text data into word and/or excel, as a tab- or space-delimited file. I point out some problem areas with this data-grabbing method, such as headers that get lost from their associated data column or date information that may not format as dates.
I then hand out the assignment, which asks them to:

Find data on a current or recent (this year) tropical system, provide the name and year of the storm and the reference web site, and plot the wind speed and pressure variables against time. Students should label the axes and give a descriptive title to the chart.
Describe what they notice in the graphed data and if it seems believable (this allows students to decide if they have done the task correctly by using their understanding of the data).
Predict what will happen if the storm a) intensifies or b) weakens.
I then provide another data set (of any long-duration tropical storm that formed, weakened and later re-intensified) and ask them to go through the same process of plotting and interpretation.
I tell them that some future climate predictions are for more storms with lower central pressures and ask which of the two charts best represents that future scenario, and why.

(Note: this resource was added to OER Commons as part of a batch upload of over 2,200 records. If you notice an issue with the quality of the metadata, please let us know by using the 'report' button and we will flag it for consideration.)
Subject:
Applied Science
Atmospheric Science
Biology
Environmental Science
Life Science
Mathematics
Measurement and Data
Physical Science
Material Type:
Activity/Lab
Homework/Assignment
Provider:
Science Education Resource Center (SERC) at Carleton College
Provider Set:
Teach the Earth
Author:
Lisa Doner
Date Added:
11/24/2020
Improving Communication of Flood Forecasts
Read the Fine Print
Rating
0.0 stars

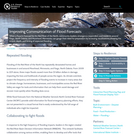
When a flood is forecast for the Red River of the North, community leaders, emergency responders, and residents around Fargo, North Dakota, and Moorhead, Minnesota, can gauge their need for preparation by accessing visualizations showing the extent, depth, and timing of expected flooding.

Subject:
Atmospheric Science
Physical Science
Material Type:
Case Study
Provider:
National Oceanic and Atmospheric Administration
Provider Set:
U.S. Climate Resilience Toolkit
Date Added:
08/29/2016
Perspectives on Ocean Science: Global Warming, Insurance Premiums, and Top Model -: The Whole Story
Read the Fine Print
Rating
0.0 stars

Join climate modeling expert Guillermo Auad as he explains the various kinds of models that researchers use to understand and forecast climate scenarios and how this science has impacts well outside of the research community. (46 minutes)

Subject:
Applied Science
Environmental Science
Material Type:
Lecture
Provider:
UCTV Teacher's Pet
Date Added:
09/11/2012
Predicting Weather and Understanding Weather Systems
Conditional Remix & Share Permitted
CC BY-NC-SA
Rating
0.0 stars

The assignment requires students to observe the weather map in the newspaper for four consecutive days. On the first day they are instructed to choose a location somewhere in the country. The will record the weather conditions there and observe any weather systems that exist elsewhere in the country. They then make predictions of how they expect weather in their location to change over the subsequent three days.

(Note: this resource was added to OER Commons as part of a batch upload of over 2,200 records. If you notice an issue with the quality of the metadata, please let us know by using the 'report' button and we will flag it for consideration.)
Subject:
Atmospheric Science
Biology
Life Science
Physical Science
Material Type:
Activity/Lab
Provider:
Science Education Resource Center (SERC) at Carleton College
Provider Set:
Teach the Earth
Author:
Carla Grandy
Date Added:
08/06/2019
Prediction and Predictability in the Atmosphere and Oceans
Conditional Remix & Share Permitted
CC BY-NC-SA
Rating
0.0 stars

Forecasting is the ultimate form of model validation. But even if a perfect model is in hand, imperfect forecasts are likely. This course will cover the factors that limit our ability to produce good forecasts, will show how the quality of forecasts can be gauged a priori (predicting our ability to predict!), and will cover the state of the art in operational atmosphere and ocean forecasting systems.

Subject:
Algebra
Atmospheric Science
Mathematics
Oceanography
Physical Science
Statistics and Probability
Material Type:
Full Course
Provider:
MIT
Provider Set:
MIT OpenCourseWare
Author:
Hansen, Jim
Date Added:
02/01/2003
Project Appraisal in Developing Countries
Conditional Remix & Share Permitted
CC BY-NC-SA
Rating
0.0 stars

This course covers techniques of financial analysis of investment expenditures as well as the economic and distributive appraisal of those projects. The course gives special consideration to cases in the developing world. Students will engage in a critical analysis of these tools and their role in the political economy of international development. The course will cover topics such as alternative planning strategies for conditions of uncertainty; organizations and project cycle management; the political environment; and interactions of clients and advisers, engineers, planners, policy analysts, and other professionals.
Introductory micro-economics is a pre-requisite for this course.

Subject:
Business and Communication
Cultural Geography
Economics
Finance
Social Science
Material Type:
Full Course
Provider:
MIT
Provider Set:
MIT OpenCourseWare
Author:
Kim, Annette
Date Added:
02/01/2005
Science and Policy of Natural Hazards
Conditional Remix & Share Permitted
CC BY-NC-SA
Rating
0.0 stars

This course examines the science of natural catastrophes such as earthquakes and hurricanes and explores the relationships between the science of and policy toward such hazards. It presents the causes and effects of these phenomena, discusses their predictability, and examines how this knowledge influences policy making. This course includes intensive practice in the writing and presentation of scientific research and summaries for policy makers.

Subject:
Applied Science
Atmospheric Science
Career and Technical Education
Environmental Science
Environmental Studies
Physical Science
Political Science
Social Science
Material Type:
Full Course
Provider:
MIT
Provider Set:
MIT OpenCourseWare
Author:
Connor, Jane
Emanuel, Kerry
Rondenay, Stephane
Date Added:
02/01/2010
Science and Policy of Natural Hazards
Conditional Remix & Share Permitted
CC BY-NC-SA
Rating
0.0 stars

This course examines the science of natural catastrophes such as earthquakes and hurricanes and explores the relationships between the science of and policy toward such hazards. It presents the causes and effects of these phenomena, discusses their predictability, and examines how this knowledge influences policy making. This course includes intensive practice in the writing and presentation of scientific research and summaries for policy makers.

Subject:
Applied Science
Environmental Science
Material Type:
Activity/Lab
Homework/Assignment
Lecture Notes
Syllabus
Provider:
MIT
Provider Set:
MIT OpenCourseWare
Author:
Jane Connor
Kerry Emanuel
Stephane Rondenay
Date Added:
01/01/2009
Using beryllium-7 to predict monsoons
Unrestricted Use
CC BY
Rating
0.0 stars

This resource is a video abstract of a research paper created by Research Square on behalf of its authors. It provides a synopsis that's easy to understand, and can be used to introduce the topics it covers to students, researchers, and the general public. The video's transcript is also provided in full, with a portion provided below for preview:

"Monsoons impact millions of people every year --farmers rely on rain for their harvests, and lives are threatened by flooding or landslides. And yet, it remains very hard to predict monsoons early and accurately. European researchers have now devised a new way to estimate the monsoon season in India. This innovative approach uses a rare isotope, beryllium-seven.The forecasts are not only more accurate than traditional methods, but also available earlier, which could give governments and residents more time to prepare. This unusual weather-tracking approach works because of how air circulates on Earth. Each hemisphere features three large-scale patterns, or cells: the Hadley, Ferrel, and polar cells. Where two cells meet is a convergence zone. Monsoons --seasonal shifts in wind that trigger heavy rain --happen at the intertropical convergence zone, or ITCZ. Monsoons are seasonal because the Earth’s tilt affects the ITCZ’s location..."

The rest of the transcript, along with a link to the research itself, is available on the resource itself.

Subject:
Atmospheric Science
Physical Science
Material Type:
Diagram/Illustration
Reading
Provider:
Research Square
Provider Set:
Video Bytes
Date Added:
09/20/2019
Weather Forecasting
Read the Fine Print
Educational Use
Rating
0.0 stars

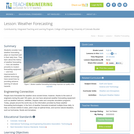
Students begin this lesson by considering how weather forecasting plays an important part in their daily lives. They learn about the history of weather forecasting -- from old weather proverbs to modern forecasting equipment and how improvements in weather technology have saved lives by providing advance warning of natural disasters.

Subject:
Applied Science
Atmospheric Science
Engineering
Physical Science
Material Type:
Activity/Lab
Lesson Plan
Provider:
TeachEngineering
Provider Set:
TeachEngineering
Author:
Janet Yowell
Lauren Cooper
Malinda Schaefer Zarske
Date Added:
09/18/2014
Weather and Atmosphere
Read the Fine Print
Educational Use
Rating
0.0 stars

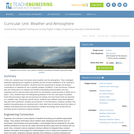
In this unit, students learn the basics about weather and the atmosphere. They investigate materials engineering as it applies to weather and the choices available to us for clothing to counteract the effects of weather. Students have the opportunity to design and analyze combinations of materials for use in specific weather conditions. In the next lesson, students also are introduced to air masses and weather forecasting instrumentation and how engineers work to improve these instruments for atmospheric measurements on Earth and in space. Then, students learn the distinguishing features of the four main types of weather fronts that accompany high and low pressure air masses and how those fronts are depicted on a weather map. During this specific lesson, students learn different ways that engineers help with storm prediction, analysis and protection. In the final lesson, students consider how weather forecasting plays an important part in their daily lives by learning about the history of weather forecasting and how improvements in weather technology have saved lives by providing advance warning of natural disasters.

Subject:
Applied Science
Atmospheric Science
Engineering
Physical Science
Material Type:
Full Course
Provider:
TeachEngineering
Provider Set:
TeachEngineering
Date Added:
10/14/2015