The Open Science movement is rapidly changing the scientific landscape. Because exact …
The Open Science movement is rapidly changing the scientific landscape. Because exact definitions are often lacking and reforms are constantly evolving, accessible guides to open science are needed. This paper provides an introduction to open science and related reforms in the form of an annotated reading list of seven peer-reviewed articles, following the format of Etz et al. (2018). Written for researchers and students - particularly in psychological science - it highlights and introduces seven topics: understanding open science; open access; open data, materials, and code; reproducible analyses; preregistration and registered reports; replication research; and teaching open science. For each topic, we provide a detailed summary of one particularly informative and actionable article and suggest several further resources. Supporting a broader understanding of open science issues, this overview should enable researchers to engage with, improve, and implement current open, transparent, reproducible, replicable, and cumulative scientific practices.
The students will use ACC basketball statistics to practice the process of …
The students will use ACC basketball statistics to practice the process of converting fractions to decimals then to percents and will learn how to create and edit a spreadsheet. They will then use this spreadsheet to analyze their data. This unit is done during the basketball season which takes approximately 15 weeks from the middle of November to the middle of March. Teachers must have Clarisworks to open the sample spreadsheet in the lesson, but may recreate it in another spreadsheet program.
A one-stop shop to get started on the key considerations about data …
A one-stop shop to get started on the key considerations about data for AI! Learn how crowdsourcing offers a viable means to leverage human intelligence at scale for data creation, enrichment and interpretation, demonstrating a great potential to improve both the performance of AI systems and their trustworthiness and increase the adoption of AI in general.
Students work as physicists to understand centripetal acceleration concepts. They also learn …
Students work as physicists to understand centripetal acceleration concepts. They also learn about a good robot design and the accelerometer sensor. They also learn about the relationship between centripetal acceleration and centripetal force governed by the radius between the motor and accelerometer and the amount of mass at the end of the robot's arm. Students graph and analyze data collected from an accelerometer, and learn to design robots with proper weight distribution across the robot for their robotic arms. Upon using a data logging program, they view their own data collected during the activity. By activity end , students understand how a change in radius or mass can affect the data obtained from the accelerometer through the plots generated from the data logging program. More specifically, students learn about the accuracy and precision of the accelerometer measurements from numerous trials.
Data structures play a central role in modern computer science. You interact …
Data structures play a central role in modern computer science. You interact with data structures even more often than with algorithms (think Google, your mail server, and even your network routers). In addition, data structures are essential building blocks in obtaining efficient algorithms. This course covers major results and current directions of research in data structure. Acknowledgments Thanks to videographers Martin Demaine and Justin Zhang.
In analyzing fiscal issues, conventional public finance approaches focus mainly on taxation …
In analyzing fiscal issues, conventional public finance approaches focus mainly on taxation and public spending. Policymakers and practitioners rarely explore solutions by examining the fundamental problem: the failure of interested parties to act collectively to internalize the positive externalities generated by public goods. Public finance is merely one of many possible institutional arrangements for assigning the rights and responsibilities to public goods consumption. This system is currently under stress because of the financial crisis. The first part of the class will focus on collective action and its connection with local public finance. The second part will explore alternative institutional arrangements for mediating collective action problems associated with the provision of local public goods. The objective of the seminar is to broaden the discussion of local public finance by incorporating collective action problems into the discourse. This inclusion aims at exploring alternative institutional arrangements for financing local public services in the face of severe economic downturn. Applications of emerging ideas to the provision of public health, education, and natural resource conservation will be discussed.
The veracity of substantive research claims hinges on the way experimental data …
The veracity of substantive research claims hinges on the way experimental data are collected and analyzed. In this article, we discuss an uncomfortable fact that threatens the core of psychology’s academic enterprise: almost without exception, psychologists do not commit themselves to a method of data analysis before they see the actual data. It then becomes tempting to fine tune the analysis to the data in order to obtain a desired result—a procedure that invalidates the interpretation of the common statistical tests. The extent of the fine tuning varies widely across experiments and experimenters but is almost impossible for reviewers and readers to gauge. To remedy the situation, we propose that researchers preregister their studies and indicate in advance the analyses they intend to conduct. Only these analyses deserve the label “confirmatory,” and only for these analyses are the common statistical tests valid. Other analyses can be carried out but these should be labeled “exploratory.” We illustrate our proposal with a confirmatory replication attempt of a study on extrasensory perception.
Ongoing technological developments have made it easier than ever before for scientists …
Ongoing technological developments have made it easier than ever before for scientists to share their data, materials, and analysis code. Sharing data and analysis code makes it easier for other researchers to re-use or check published research. These benefits will only emerge if researchers can reproduce the analysis reported in published articles, and if data is annotated well enough so that it is clear what all variables mean. Because most researchers have not been trained in computational reproducibility, it is important to evaluate current practices to identify practices that can be improved. We examined data and code sharing, as well as computational reproducibility of the main results, without contacting the original authors, for Registered Reports published in the psychological literature between 2014 and 2018. Of the 62 articles that met our inclusion criteria, data was available for 40 articles, and analysis scripts for 37 articles. For the 35 articles that shared both data and code and performed analyses in SPSS, R, Python, MATLAB, or JASP, we could run the scripts for 31 articles, and reproduce the main results for 20 articles. Although the articles that shared both data and code (35 out of 62, or 56%) and articles that could be computationally reproduced (20 out of 35, or 57%) was relatively high compared to other studies, there is clear room for improvement. We provide practical recommendations based on our observations, and link to examples of good research practices in the papers we reproduced.
This course presents real-world examples in which quantitative methods provide a significant …
This course presents real-world examples in which quantitative methods provide a significant competitive edge that has led to a first order impact on some of today's most important companies. We outline the competitive landscape and present the key quantitative methods that created the edge (data-mining, dynamic optimization, simulation), and discuss their impact.
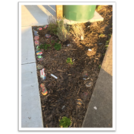
STUDENT ACTIVITY - 1st -- VAThis is a distance-learning lesson students can …
STUDENT ACTIVITY - 1st -- VAThis is a distance-learning lesson students can complete at home.Students will collect data outdoors and record the data in a table. Then, they will compare the numbers collected by writing greater-than, less-than or equal-to statements.This activity was created by Out Teach (out-teach.org), a nonprofit providing outdoor experiential learning to transform Science education for students in under-served communities. .
The webinar features Dr. Joshua Rosenberg from the University of Tennessee, Knoxville …
The webinar features Dr. Joshua Rosenberg from the University of Tennessee, Knoxville and Dr. Cynthia D’Angelo from the University of Illinois at Urbana-Champaign discussing best practices examples for using R. They will present: a) general strategies for using R to analyze educational data and b) accessing and using data on the Open Science Framework (OSF) with R via the osfr package. This session is for those both new to R and those with R experience looking to learn more about strategies and workflows that can help to make it possible to analyze data in a more transparent, reliable, and trustworthy way.
This short course provides training materials about how to create a set …
This short course provides training materials about how to create a set of publication data, gather additional information about the data through an API (Application Programming Interface), clean the data, and analyze the data in various ways. Developing these skills will assist academic librarians who are:
Negotiating a renewal of a journal package or an open access publishing agreement, Interested in which journals the institution's authors published in or which repositories the institution’s authors shared their works in, Looking to identify publications that could be added to your repository, Searching for authors who do or do not publish OA for designing outreach programs, or Tracking how open access choices have changed over time. After completing the lessons, the user will be able to gain an understanding of an institution’s publishing output, such as number of publications per year, open access status of the publications, major funders of the research, estimates of how much funding might be spent towards article processing charges (APCs), and more. The user will also be better prepared to think critically about institutional publishing data to make sustainable and values-driven scholarly communications decisions.
The course is presented in two sections. Section 1 describes how to build a dataset. Section 2 describes a free, open source tool for working with data. Examples of how to do analyses both in OpenRefine and Microsoft Excel are provided.
This short course was created for the Scholarly Communication Notebook. The file "Analyzing Institutional Publishing Output-A Short Course.docx" serves as a table of contents for the materials.
A statistics lesson on describing and making claims from data representations, specifically …
A statistics lesson on describing and making claims from data representations, specifically linearly increasing data. Applies ideas of rate-of-change to develop writing a linear equation to fit the data, using the equation to interpolate and extrapolate additional information, and integrating the mathematical interpretation appropriately into a social sciences argument.
Students prepare for the associated activity in which they investigate acceleration by …
Students prepare for the associated activity in which they investigate acceleration by collecting acceleration vs. time data using the accelerometer of a sliding Android device. Based on the experimental set-up for the activity, students form hypotheses about the acceleration of the device. Students will investigate how the force on the device changes according to Newton's Second Law. Different types of acceleration, including average, instantaneous and constant acceleration, are introduced. Acceleration and force is described mathematically and in terms of processes and applications.
Students investigate the motion of a simple pendulum through direct observation and …
Students investigate the motion of a simple pendulum through direct observation and data collection using Android® devices. First, student groups create pendulums that hang from the classroom ceiling, using Android smartphones or tablets as the bobs, taking advantage of their built-in accelerometers. With the Android devices loaded with the (provided) AccelDataCapture app, groups explore the periodic motion of the pendulums, changing variables (amplitude, mass, length) to see what happens, by visual observation and via the app-generated graphs. Then teams conduct formal experiments to alter one variable while keeping all other parameters constant, performing numerous trials, identifying independent/dependent variables, collecting data and using the simple pendulum equation. Through these experiments, students investigate how pendulums move and the changing forces they experience, better understanding the relationship between a pendulum's motion and its amplitude, length and mass. They analyze the data, either on paper or by importing into a spreadsheet application. As an extension, students may also develop their own algorithms in a provided App Inventor framework in order to automatically note the time of each period.
This is a free textbook teaching introductory statistics for undergraduates in Psychology. …
This is a free textbook teaching introductory statistics for undergraduates in Psychology. This textbook is part of a larger OER course package for teaching undergraduate statistics in Psychology, including this textbook, a lab manual, and a course website. All of the materials are free and copiable, with source code maintained in Github repositories.
Python es un lenguaje de programación general que es útil para escribir …
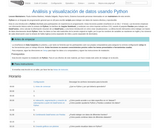
Python es un lenguaje de programación general que es útil para escribir scripts para trabajar con datos de manera efectiva y reproducible. Esta es una introducción a Python diseñada para participantes sin experiencia en programación. Estas lecciones pueden enseñarse en un día (~ 6 horas). Las lecciones empiezan con información básica sobre la sintaxis de Python, la interface de Jupyter Notebook, y continúan con cómo importar archivos CSV, usando el paquete Pandas para trabajar con DataFrames, cómo calcular la información resumen de un DataFrame, y una breve introducción en cómo crear visualizaciones. La última lección demuestra cómo trabajar con bases de datos directamente desde Python. Nota: los datos no han sido traducidos de la versión original en inglés, por lo que los nombres de variables se mantienen en inglés y los números de cada observación usan la sintaxis de habla inglesa (coma separador de miles y punto separador de decimales).
No restrictions on your remixing, redistributing, or making derivative works. Give credit to the author, as required.
Your remixing, redistributing, or making derivatives works comes with some restrictions, including how it is shared.
Your redistributing comes with some restrictions. Do not remix or make derivative works.
Most restrictive license type. Prohibits most uses, sharing, and any changes.
Copyrighted materials, available under Fair Use and the TEACH Act for US-based educators, or other custom arrangements. Go to the resource provider to see their individual restrictions.