This activity demonstrates how to import data from the Internet and make …
This activity demonstrates how to import data from the Internet and make EXCEL graphs. The instructions included were provided by a classroom teacher who used these instructions with high school students.
In this activity, student teams learn about research design and design a …
In this activity, student teams learn about research design and design a controlled experiment exploring the relationship between a hypothetical planet, an energy source, and distance. They analyze the data and derive an equation to describe the observations. Includes student data sheets, a teacher's guide, and a tutorial on how to use the spreadsheet program Excel. This is Activity A in module 3, titled "Using Mathematic Models to Investigate Planetary Habitability," of the resource, Earth Climate Course: What Determines a Planet's Climate? The course aims to help students to develop an understanding of our environment as a system of human and natural processes that result in changes that occur over various space and time scales.
In this activity, students build a simple computer model to determine the …
In this activity, students build a simple computer model to determine the black body surface temperature of planets in our solar system: Mercury, Venus, Earth, Mars, Jupiter, Saturn, Uranus, Neptune and Pluto. Experiments altering the luminosity and distance to the light source will allow students to determine the energy reaching the object and its black body temperature. The activity builds on student outcomes from activity A, "Finding a Mathematical Description of a Physical Relationship." It also supports inquiry into a real-world problem, the effect of urban heat islands and deforestation on climate. Includes a teacher's guide, student worksheets, and an Excel tutorial. This is Activity B of module 3, titled "Using Mathematic Models to Investigate Planetary Habitability," of the resource, Earth Climate Course: What Determines a Planet's Climate? The course aims to help students to develop an understanding of our environment as a system of human and natural processes that result in changes that occur over various space and time scales.
Students explore how mathematical descriptions of the physical environment can be fine-tuned …
Students explore how mathematical descriptions of the physical environment can be fine-tuned through testing using data. In this activity, student teams obtain satellite data measuring the Earth's albedo, and then input this data into a spreadsheet-based radiation balance model, GEEBITT. They validate their results against published the published albedo value of the Earth, and conduct similar comparisons Mercury, Venus and Mars. The resource includes an Excel spreadsheet tutorial, an investigation, student data sheets and a teacher's guide. Students apply their understanding to the real life problem of urban heat islands and deforestation. The activity links builds on student outcomes from activities A and B: "Finding a Mathematical Description of a Physical Relationship," and "Making a Simple Mathematical Model." This is Activity C in module 3, Using Mathematical Models to Investigate Planetary Habitability, of the resource, Earth Climate Course: What Determines a Planet's Climate? The course aims to help students to develop an understanding of our environment as a system of human and natural processes that result in changes that occur over various space and time scales.
This is a lesson about the vertical dimension of the atmosphere and …
This is a lesson about the vertical dimension of the atmosphere and includes four activities. Activity 1 Introduces concepts related to distance, including length and height and units of measurement. Students are asked to make comparisons of distances. In activity 2, students learn about the vertical profile of the atmosphere. They work with a graph and plot the heights of objects and the layers of the atmosphere: troposphere, stratosphere, mesosphere, thermosphere, and exosphere. In activity 3, students learn about other forms of visual displays using satellite imagery. They compare images of the same weather feature, a hurricane, using two different images from MODIS and CALIPSO. One image is looking down on the hurricane from space, the other looks through the hurricane to display a profile of the hurricane. Activity 4 reinforces the concept of the vertical nature of the atmosphere. Students will take a CALIPSO satellite image that shows a profile of the atmosphere and use this information to plot mountains and clouds on their own graph of the atmosphere. The recommended order for the activities is to complete the first two activities on day one, and the second two activities on day two. Each day will require approximately 1 to 1.5 hours.
Purpose of UnitThe purpose of this Climate Science NTC Project GLAD® unit …
Purpose of UnitThe purpose of this Climate Science NTC Project GLAD® unit is a call to action, providing equity of access for all students. Through a model of instruction that promotes language development within core content, the Voices of Hope unit teaches students the science behind climate change and equips them with the tools necessary toward making a positive impact on our planet. This unit was written for 4th - 7th grade.
Atmospheric scientists use computer models to forecast the position of a moving …
Atmospheric scientists use computer models to forecast the position of a moving volcanic cloud, and remote sensing can identify its components, including gases and aerosols. This resource provides ideas for classroom investigation of these topics, and directions for a demonstration of light scattering by aerosols. The lesson ideas are from PUMAS - Practical Uses of Math and Science - a collection of brief examples created by scientists and engineers showing how math and science topics taught in K-12 classes have real world applications.
In this activity, students use satellite imagery to assess potential danger associated …
In this activity, students use satellite imagery to assess potential danger associated with selecting a new and safer location for the town of Villarrica, along with its corresponding communication and evacuation routes. Satellite imagery and a topographic map are included. The resource is from PUMAS - Practical Uses of Math and Science - a collection of brief examples created by scientists and engineers showing how math and science topics taught in K-12 classes have real world applications.
This lesson was developed to give participants an understanding of Earth's water …
This lesson was developed to give participants an understanding of Earth's water cycle. In this one-hour long activity, students participate in a webquest to learn about the water cycle, and then build a mini-model of the water cycle to observe how water moves through Earth's four systems. The activity uses the 5E instructional model and is part of the "Survivor Earth" series of one-hour lessons.
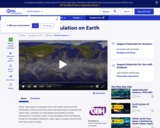
This simulation from the National Center for Atmospheric Research portrays annual patterns …
This simulation from the National Center for Atmospheric Research portrays annual patterns in water vapor and precipitation across the globe, illustrating general circulation patterns as well as seasonal and regional variation.
In this activity, students learn to interpret current weather maps. They will …
In this activity, students learn to interpret current weather maps. They will observe weather map loop animations on the internet, learn the concept of Zulu time (Universal Time Coordinated, UTC) and visualize the movement of fronts and air masses. They will then analyze a specific weather station model, generate a meteogram from their observations, and answer a set of questions about their observations.
This background chapter reviews the basic principles of meteorology that educators need …
This background chapter reviews the basic principles of meteorology that educators need to guide inquiry activities in the classroom. Topics include structure of the atmosphere, Coriolis effect, water cycle, greenhouse effect, cyclones, anticyclones, and jet streams. This is chapter 2 of Meteorology: An Educator's Resource for Inquiry-Based Learning for Grades 5-9. The guide includes a discussion of learning science, the use of inquiry in the classroom, instructions for making simple weather instruments, and more than 20 weather investigations ranging from teacher-centered to guided and open inquiry investigations.
In this exercise, students investigate long-term weather variables such as temperature and …
In this exercise, students investigate long-term weather variables such as temperature and humidity to determine their affect on the climate of a particular region. They will choose two cities, use an online resource to obtain geographic and climatic information for each, and use a spreadsheet program to produce graphs that compare data for the two cities.
This module contains an 8-lesson curriculum to study greenhouse gases and global …
This module contains an 8-lesson curriculum to study greenhouse gases and global warming using data and visualizations. The students will summarize the issue in a mock debate or a presentation.
(Note: this resource was added to OER Commons as part of a batch upload of over 2,200 records. If you notice an issue with the quality of the metadata, please let us know by using the 'report' button and we will flag it for consideration.)
This demonstration will show how increased temperatures will hasten the melting of …
This demonstration will show how increased temperatures will hasten the melting of ice in the environment, contributing to a rise in sea level and subsequent flooding of coastal areas. Materials required include 2 aquariums, plastic wrap, a clamp light with a 60 watt bulb, modeling clay, ice, pebbles and rocks, and a ruler. Teacher background information, student worksheets and a scoring rubric are included. This is Activity 3 of the learning module, Too Many Blankets, part of the lesson series, The Potential Consequences of Climate Variability and Change.
This resource introduces the concept of wind chill, the formula used to …
This resource introduces the concept of wind chill, the formula used to measure it and relates it to the causes of hypothermia. A simple experiment using a pie pan, sand, fan and a thermometer demonstrates this concept. The resource is from PUMAS - Practical Uses of Math and Science - a collection of brief examples created by scientists and engineers showing how math and science topics taught in K-12 classes have real world applications.
In this activity, students investigate the mass, pressure, and temperature of air. …
In this activity, students investigate the mass, pressure, and temperature of air. They will measure and record the mass and temperature of a bottle of air as they increase its pressure by pumping in more air, record their observations, and answer some questions about what they have seen.
This activity is a daily lab where two students read a thermometer …
This activity is a daily lab where two students read a thermometer and identify the cloud type for a week. They record it on the board first and we all record it in our journals. A graph of the entire year is also completed and we can analyze the data as we go. We get two new "scientists" each week and we do it all year. I start the first week of school.
This quiz game is intended to help students review for an upcoming …
This quiz game is intended to help students review for an upcoming exam. Topics of questions are randomly determined by spinning a wheel. Teams answer questions using electronic CPS handhelds.
(Note: this resource was added to OER Commons as part of a batch upload of over 2,200 records. If you notice an issue with the quality of the metadata, please let us know by using the 'report' button and we will flag it for consideration.)
No restrictions on your remixing, redistributing, or making derivative works. Give credit to the author, as required.
Your remixing, redistributing, or making derivatives works comes with some restrictions, including how it is shared.
Your redistributing comes with some restrictions. Do not remix or make derivative works.
Most restrictive license type. Prohibits most uses, sharing, and any changes.
Copyrighted materials, available under Fair Use and the TEACH Act for US-based educators, or other custom arrangements. Go to the resource provider to see their individual restrictions.