Updating search results...

Search Resources

229 Results

View
Selected filters:
  • atmospheric-science
Space Math IX
Unrestricted Use
Public Domain
Rating
0.0 stars

This collection of activities is based on a weekly series of space science mathematics problems distributed during the 2012-2013 school year. They were intended for students looking for additional challenges in the math and physical science curriculum in grades 5 through 12. The problems were created to be authentic glimpses of modern science and engineering issues, often involving actual research data. The problems were designed to be one-pagers with a Teacher’s Guide and Answer Key as a second page.

Subject:
Applied Science
Astronomy
Geoscience
History
History, Law, Politics
Mathematics
Physical Science
Space Science
Technology
Material Type:
Lesson
Provider:
NASA
Provider Set:
Space Math
Date Added:
11/05/2014
The Space Place
Unrestricted Use
Public Domain
Rating
0.0 stars

This site provides fun activities for children to do and make, while they learn about space and Earth science, and the technology that enables science. The Teachers Corner on the WWW site contains curriculum supplements originally published in the ITEA (International Technology Education Association) Technology Transfer Teacher magazine.

Subject:
Astronomy
Physical Science
Material Type:
Activity/Lab
Game
Interactive
Provider:
NASA
Provider Set:
NASA Wavelength
Date Added:
02/16/2011
Student Lead Discussions: Articles from the Literature and Final Writing Assignment
Conditional Remix & Share Permitted
CC BY-NC-SA
Rating
0.0 stars

Assignment #1 Student-led discussion of articles from the literature
We assign one or two groups of two or three students to each of four or four or five topics related to climate change, and provide each group a set of related articles from the literature on their assigned topic. The group will lead a one-hour, in-class discussion on the topic, with up to a dozen students and one instructor in each discussion. In preparation for the discussion, the discussion co-leaders must collectively write a set of "Reading Questions" about each assigned article, which help readers focus on the key points made by the articles and can serve as points of discussion. The other students participating in the discussion must read the articles with the aid of these Reading Questions and annotate the portions of the articles that address the Reading Questions. We (instructors) evaluate the Reading Questions written by the co-leaders (they receive a shared grade for these), and we also check the annotated articles turned in by the other discussion participants to ensure that they prepared to participate in the discussion (they receive individual grades this). Discussion co-leaders each receive a grade for the quality of their discussion leadership.

The purpose of this assignment is in part to help students prepare for their final writing assignment by requiring that they read a set of articles closely enough to help other students discuss and understand the key points, and get feedback about their level of understanding, up to a month before the final paper on the topic is due. The immediate outcome that we expect from this assignment is a demonstration that students can read the assigned articles critically, identify and articulate the key points, and help engage other students in a discussion about the articles, including conceptually important or difficult aspects of them.
Assignment #2: Final writing assignment

For this assignment, which follows from the previous one, students are asked to:

locate two or more significant additional articles that relate closely to the articles on which they based the discussion that they co-led; and
write a 8-12 page (typed, double spaced) overview of the history and current state of our scientific understanding about the topic(s) covered by the set of discussion articles, based on the articles themselves plus relevant material presented in class or in assigned reading. In particular, wherever justified by the source material, students should try to include the following in the narrative:

initial observations/evidence;
initial hypotheses posed to account for initial observations/evidence (including external forcings and feedbacks);
subsequent observations/evidence that have confirmed or disproved earlier hypotheses;
technology that made making observations/gathering evidence possible and led to breakthroughs in understanding;
scientific controversies and how they played out historically or are currently playing out;
current understanding and remaining uncertainties.

The outcome should be a written demonstration of the student's ability to analyze and synthesize a set of articles from the literature and supporting materials provided in class to describe the history, current state, and unresolved aspects of our scientific understanding of an interdisciplinary aspect of climate change.

(Note: this resource was added to OER Commons as part of a batch upload of over 2,200 records. If you notice an issue with the quality of the metadata, please let us know by using the 'report' button and we will flag it for consideration.)


Subject:
Applied Science
Biology
Business and Communication
Communication
Composition and Rhetoric
English Language Arts
Environmental Science
Life Science
Oceanography
Physical Science
Material Type:
Activity/Lab
Homework/Assignment
Provider:
Science Education Resource Center (SERC) at Carleton College
Provider Set:
Teach the Earth
Author:
Dave Dempsey
Date Added:
08/21/2020
Surface Color and Effect of Temperature Change
Read the Fine Print
Rating
0.0 stars

This activity builds the basic understanding that the heating (indicated by temperature differences) of an object is related to the object’s surface color. Materials required for this investigation include a pair of thermometers, light and dark construction paper, a heat lamp, and two foam cups and two large containers. The resource includes teaching tips and questions to guide student discussion. This is chapter 3 of Meteorology: An Educator's Resource for Inquiry-Based Learning for Grades 5-9. The guide includes a discussion of learning science, the use of inquiry in the classroom, instructions for making simple weather instruments, and more than 20 weather investigations ranging from teacher-centered to guided and open inquiry investigations.

Subject:
Atmospheric Science
Geoscience
Physical Science
Material Type:
Activity/Lab
Lesson Plan
Provider:
NASA
Provider Set:
NASA Wavelength
Date Added:
11/05/2014
Survivor: Earth
Read the Fine Print
Rating
0.0 stars

This series of ten lessons has been developed to teach students about local and global water issues. They are based on NASA’s Global Precipitation Measurement (GPM) Mission. The activities are done largely outdoors and include scientific data collection and analysis and integrate technology. Many of the lessons involve data collected based on protocols from the GLOBE Program. Each lesson is designed to take one hour; the lessons build on each other, but can also be used independently. Each lesson topic includes a lesson plan, PowerPoint presentation, student capture sheet and capture sheet answer guide.

Subject:
Atmospheric Science
Geoscience
History
History, Law, Politics
Physical Science
Material Type:
Activity/Lab
Data Set
Lesson Plan
Provider:
NASA
Provider Set:
NASA Wavelength
Date Added:
11/05/2014
TIMED Spacecraft Model
Read the Fine Print
Rating
0.0 stars

This is a model for students to assemble, aimed at enhancing their knowledge of NASA spacecraft and scientific facts. The cover contains background information about the Thermosphere, Ionosphere, Mesosphere Energetics and Dynamics (TIMED) mission as well as two language arts activities to reinforce space science vocabulary and concepts.

Subject:
Applied Science
Atmospheric Science
Engineering
Geoscience
Physical Science
Technology
Material Type:
Activity/Lab
Data Set
Provider:
NASA
Provider Set:
NASA Wavelength
Date Added:
11/05/2014
Teacher Background: The Dancing Lights Program
Read the Fine Print
Some Rights Reserved
Rating
0.0 stars

Dancing Lights: Exploring the Aurora through Art and Writing is a science-in-literacy program about the aurora. Students in grades 3-5 write and illustrate their perceptions, ideas, and facts pertaining to auroral science. This short educator background primer was based upon interactions with teachers during Dancing Lights workshops and is meant as a quick guide to the science of the aurora.

Subject:
Atmospheric Science
Geoscience
Physical Science
Space Science
Material Type:
Lecture
Provider:
NASA
Provider Set:
NASA Wavelength
Date Added:
11/05/2014
Temperature Variations and Habitability: Activity A Observing, Describing, and Adapting to Environmental Variations
Read the Fine Print
Rating
0.0 stars

In this activity, student teams design and conduct a scientific investigation in which they explore the conditions necessary for life. They conduct observations of environmental conditions both indoor and outdoor, and determine the range of variation they see. They compare these data with published temperature data for Earth, Mars, Pluto and Venus. The activity supports inquiry into the real world challenge of searching for life in extreme environments. The resource includes several student data sheets, data table and images, and a teacher's guide. Materials needed for this activity include weather instruments (e.g., thermometers, barometers, anemometers). This is Activity A of two activities in the first module, titled "Temperature variations and habitability," of the resource, "Earth Climate Course: What Determines a Planet's Climate?" The course aims to help students to develop an understanding of our environment as a system of human and natural processes that result in changes that occur over various space and time scales.

Subject:
Atmospheric Science
Geoscience
History
History, Law, Politics
Life Science
Physical Science
Space Science
Material Type:
Activity/Lab
Data Set
Lesson Plan
Student Guide
Provider:
NASA
Provider Set:
NASA Wavelength
Date Added:
11/05/2014
Temperature Variations and Habitability: Activity B Relating Factors that Influence Planetary Temperature and Habitability
Read the Fine Print
Rating
0.0 stars

In this activity, student teams create a knowledge map of the essential characteristics or factors of a planet with a habitable climate, identifying range of inputs, outputs and variables of a planetary environmental system. Identified characteristics are compared to extreme environments on Earth, such as the Antarctic or the Sahara desert, and are used to consider the real life challenge of searching for life in extreme environments. The resource includes a student data sheet, questions, teacher's guide and scoring rubric. This is Activity B of two activities in the first module, titled "Temperature variations and habitability," of the resource, Earth Climate Course: What Determines a Planet's Climate? The course aims to help students to develop an understanding of our environment as a system of human and natural processes that result in changes that occur over various space and time scales.

Subject:
Atmospheric Science
Geoscience
History
History, Law, Politics
Life Science
Oceanography
Physical Science
Space Science
Material Type:
Activity/Lab
Data Set
Lesson Plan
Provider:
NASA
Provider Set:
NASA Wavelength
Date Added:
11/05/2014
Temperature vs. Carbon Dioxide
Read the Fine Print
Rating
0.0 stars

Students examine graphical and tabular data to determine whether the evidence suggests that becomes CO² concentrations and temperature rise can be linked causally. The resource provides graphs and tabular data for student investigation and a student worksheet. This is an activity from Space Update, a collection of resources and activities provided to teach about Earth and space. Summary background information, data and images supporting the activity are available on the Earth Update data site.

Subject:
Atmospheric Science
Geoscience
Mathematics
Physical Science
Material Type:
Activity/Lab
Data Set
Diagram/Illustration
Provider:
NASA
Provider Set:
NASA Wavelength
Date Added:
11/05/2014
Think Scientifically: The Sun and The Water Cycle
Read the Fine Print
Rating
0.0 stars

Learners will read or listen to a story about two sisters, Marisol and Sofia, as they explore the Sun's role in the water cycle. Additionally, numerous extension resources are included in the accompanying educator guide, such as suggestions for no-cost language arts activities, links to further science activities, a book walk cue chart to guide classroom discussion before, during, and after the story, a graphic organizer, and alignments to the National Science Education Standards (NSES) and the Next Generation Science Standards (NGSS).

Subject:
Hydrology
Physical Science
Material Type:
Activity/Lab
Lesson Plan
Provider:
NASA
Provider Set:
NASA Wavelength
Date Added:
11/05/2014
Tornado in a Box
Read the Fine Print
Rating
0.0 stars

This chapter provides a series of investigations, ranging from teacher-centered to open inquiry, that involve the formation of clouds in a model cyclone, and demonstrating how the availability of heat (indicated by temperature) affects formation and duration of the cyclone. Instructions for building the experimental apparatus is found in Appendix 6. Additional materials needed include a heat source, beaker, thermometer, and a metal pan. The resource includes background information, teaching tips and questions to guide student discussion. This is chapter 13 of Meteorology: An Educator's Resource for Inquiry-Based Learning for Grades 5-9. The guide includes a discussion of learning science, the use of inquiry in the classroom, instructions for making simple weather instruments, and more than 20 weather investigations ranging from teacher-centered to guided and open inquiry investigations.

Subject:
Atmospheric Science
Geoscience
History
History, Law, Politics
Oceanography
Physical Science
Material Type:
Activity/Lab
Lesson Plan
Simulation
Provider:
NASA
Provider Set:
NASA Wavelength
Date Added:
11/05/2014
Traveling on a Rotating Sphere
Read the Fine Print
Rating
0.0 stars

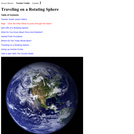
This lesson applies the science and math of the rotation of a sphere to water and wind movements on Earth. Students are introduced to convection, the Trade Winds and the Coriolis Force. Using an online visualizer, students generate trajectories and then analyze course patterns and latitudinal changes in strength. Note that this is lesson two of five on the Ocean Motion website. Each lesson investigates ocean surface circulation using satellite and model data and can be done independently. See Related URL's for links to the Ocean Motion Website that provide science background information, data resources, teacher material, student guides and a lesson matrix.

Subject:
Applied Science
Atmospheric Science
Engineering
Geoscience
Mathematics
Oceanography
Physical Science
Physics
Technology
Material Type:
Activity/Lab
Data Set
Diagram/Illustration
Interactive
Lesson Plan
Provider:
NASA
Provider Set:
NASA Wavelength
Date Added:
11/05/2014
Tropical Cyclones, Sea Surface Temperature, and Beyond
Conditional Remix & Share Permitted
CC BY-NC-SA
Rating
0.0 stars

Part 1

The SAGUARO Exploring GIS Investigations for Earth Science curriculum requries the use of ESRI's ArcView GIS software version 3.0 for Macintosh or 3.2 and higher for PC.
Use ArcGIS and data files from the SAGUARO Project's (http://pro.arcgis.com/en/pro-app/help/projects/supported-data-types-and-items.htm) Exploring Tropical Cyclones investigations. After the students are introduced to the program they are asked to determine what criteria are required for the formation of tropical cyclones.
Exploring Tropical Cyclones Unit 1 has a great deal of data for the students to use. The data is presented as layers on a world map. Different features can be turned on and off at will, and layers can be brought in from other units if desired.

Features they can work with are:

August SST
February SST
tropical cyclone tracks
locations of tropical cyclone formation for Jun-Sep
locations of tropical cyclone formation for Dec-Mar

Part 2

Students are divided into small groups (3-4 students works well) where they compare their findings (including what evidence they used) with the findings of the other group members. Each group is then asked to determine the threshold temperature for tropical cyclone formation as well as to calculate the area of the ocean that has SST equal to or above this threshold temperature (you can have them calculate this for each season, or as a total area including both February and August data).

Part 3

Class discussion of what they have found so far. Introduce them to model predictions of SST for different atmospheric CO2 levels. Propose a 2 degree C increase in tropical SST and ask what they think that will mean. What other factors might influence the formation of tropical cyclones?

Part 4

Assign an article or two (ideally a published peer reviewed article - to introduce them to this type of scientific writing - that is if you can find one that you consider appropriate for your students) that introduces them to other factors required for tropical cyclone formation and predictions of how climate change might affect them. For example an article that discusses the role of wind speed near the surface of the ocean, or vertical wind shear, or one that shows that the threshold temperature is actually predicted to increase by the same magnitude as the SST increase.
Have them write a report that summaries the criteria for cyclogenesis as well as explaining how they would go about predicting where tropical cyclones will form as a result of an increased SST. They do not need to perform all of the tests they propose! They should state what sort of information they would like to obtain and why.

(Note: this resource was added to OER Commons as part of a batch upload of over 2,200 records. If you notice an issue with the quality of the metadata, please let us know by using the 'report' button and we will flag it for consideration.)
Subject:
Applied Science
Biology
Environmental Science
Life Science
Mathematics
Measurement and Data
Oceanography
Physical Science
Material Type:
Activity/Lab
Provider:
Science Education Resource Center (SERC) at Carleton College
Provider Set:
Teach the Earth
Author:
Danielle Schmitt
Date Added:
08/31/2019
An Understanding of Feedbacks
Read the Fine Print
Rating
0.0 stars

In this activity, students analyze the results of an experiment, conduct research, and describe the potential importance of positive and negative feedbacks in governing the response of the Earth system. Teacher background information, assessment suggestions, and a scoring rubric are included.This is Activity 5 of the learning module, Global Balance, part of the lesson series, The Potential Consequences of Climate Variability and Change. Completing A Sense of Balance: Activity 1 in this module is a prerequisite to complete this investigation.

Subject:
Atmospheric Science
Geoscience
Mathematics
Physical Science
Material Type:
Activity/Lab
Provider:
NASA
Provider Set:
NASA Wavelength
Date Added:
11/05/2014
Understanding the Absorption of Energy at the Surface of the Earth
Read the Fine Print
Rating
0.0 stars

In this problem-based learning (PBL) activity, students take on the role of a student research scientist and explore the role of solar energy in determining climate. Students conduct experiments to determine the role of albedo in surface warming by investigating the temperature of a variety of surfaces in the environment. The activity should be conducted on a sunny day. Materials required for the investigation include thermometers and paper cups. The lesson is supported by teacher notes, answer key, glossary and an appendix with information about using PBL in the classroom. This is the first of three activities in Investigating the Climate System: Energy, a Balancing Act.

Subject:
Atmospheric Science
Geoscience
Physical Science
Material Type:
Activity/Lab
Lesson Plan
Provider:
NASA
Provider Set:
NASA Wavelength
Date Added:
11/05/2014
Unidata's Integrated Data Viewer
Conditional Remix & Share Permitted
CC BY-NC
Rating
0.0 stars

The Integrated Data Viewer (IDV) is a software framework for analyzing and visualizing geoscience data sets collected by the Unidata Program. The IDV may be used to display and analyze satellite imagery, gridded data, surface observations, balloon soundings, radar data and more. Most of the data are provided in real time or near-real time. The IDV can display data anywhere on the globe with a wide selection of map projections and map backgrounds including a 3D spherical globe. Over 20 kinds of 2D and 3D data displays allow users to create cross-sections, profiles, animations and value read-outs of multi-dimensional data sets. A useful feature of the site is the ability to save displays in "bundle" files for use in classroom and lab exercises. Thorough and easy-to-follow directions for IDV installation and use are provided and annual training workshops are offered by Unidata. The data viewer is available for a free download, and data sets are available to participants who are affiliated with a degree-granting institution or a non-profit institution with an education and/or research mission. This resource is part of the Using Data collection. http://serc.carleton.edu/usingdata/

Subject:
Atmospheric Science
Physical Science
Material Type:
Activity/Lab
Reading
Provider:
NAGT Cutting Edge (SERC)
Date Added:
10/23/2006
Unit 4. Urban Landscapes and Water Use
Conditional Remix & Share Permitted
CC BY-NC-SA
Rating
0.0 stars

Students are introduced to evapotranspiration (ET) and how ET varies with meteorological factors and plant factors. A pre-class video and worksheet introduce students to estimating landscape water needs from ET and precipitation data. In class, students design low water-use landscaping and calculate the water savings of water-efficient landscaping compared with turf grass.

(Note: this resource was added to OER Commons as part of a batch upload of over 2,200 records. If you notice an issue with the quality of the metadata, please let us know by using the 'report' button and we will flag it for consideration.)
Subject:
Applied Science
Biology
Career and Technical Education
Engineering
Environmental Studies
Geology
Life Science
Mathematics
Measurement and Data
Physical Science
Statistics and Probability
Material Type:
Activity/Lab
Module
Provider:
Science Education Resource Center (SERC) at Carleton College
Provider Set:
Teach the Earth
Author:
Gigi Richard
Date Added:
04/15/2020
Ups and Downs
Read the Fine Print
Rating
0.0 stars

In this activity, students examine a pair of satellite images of the ocean and determine whether there is a relationship between the height of ocean waves and the sea level. Data from the two images are plotted side by side and students discuss the reasons for their findings. The resource includes the images and a student worksheet. Summary background information, data and images supporting the activity are available on the Earth Update data site. To complete the activity, students will need to access the Space Update multimedia collection, which is available for download and purchase for use in the classroom.

Subject:
Atmospheric Science
Geoscience
Oceanography
Physical Science
Material Type:
Activity/Lab
Diagram/Illustration
Provider:
NASA
Provider Set:
NASA Wavelength
Date Added:
11/05/2014
Using Data to Understand Polar Changes
Read the Fine Print
Rating
0.0 stars

In this activity, students analyze regions of sea ice using data and ImageJ software. They measure ice mass and calculate effective albedo, and plot changes in solar energy and water/ice cover percentages. This is part 4 of a four-part activity on polar science. Data access information is provided in the attached appendix. This activity is one of several learning activities connected with the 2007 GLOBE Earth system poster.

Subject:
Applied Science
Atmospheric Science
Engineering
Geoscience
History
History, Law, Politics
Physical Science
Technology
Material Type:
Activity/Lab
Data Set
Lesson Plan
Provider:
NASA
Provider Set:
NASA Wavelength
Date Added:
11/05/2014